


Last week we gave Chopad Levels of 8026 ,Nifty made high of 8250.8 meeting our 3 Chopad Level of 8251 and closed at the highest point of the week. We got Stopped out on Monday but were with the trend from Tuesday as soon as Nifty moved above the Chopad level of 8026 and rewarded the Disciplined Chopad followers . Lets analyze how to trade market in coming expiry week.
Nifty Hourly Chart

As discussed last week Also Bull Power indicator is crossing the median line which if sustained can see relief rally coming in market till 8147/8290 odd levels.
Now as per Currently Hourly chart we have confluence of Trendline Resistance and 4×1 gann line @8286-8300 zone, so long should book profit in the zone and wait to see how market react in this zone.Support lies in range of 8176-8150 range.
Nifty Hourly Elliot Wave Chart

Hourly charts on Elliot wave shows 8279 is target for this rise, unable to rise beyond this can again see market falling back.
Nifty Pyrapoint Analysis

As per Pyrapoint Analysis till 8200 is held @90 degree line bulls are in control,can push nifty up till 8351 zone @ 45 degree line once congestion zone of 8280/8300 is crossed. Bear have life below 8150 only.
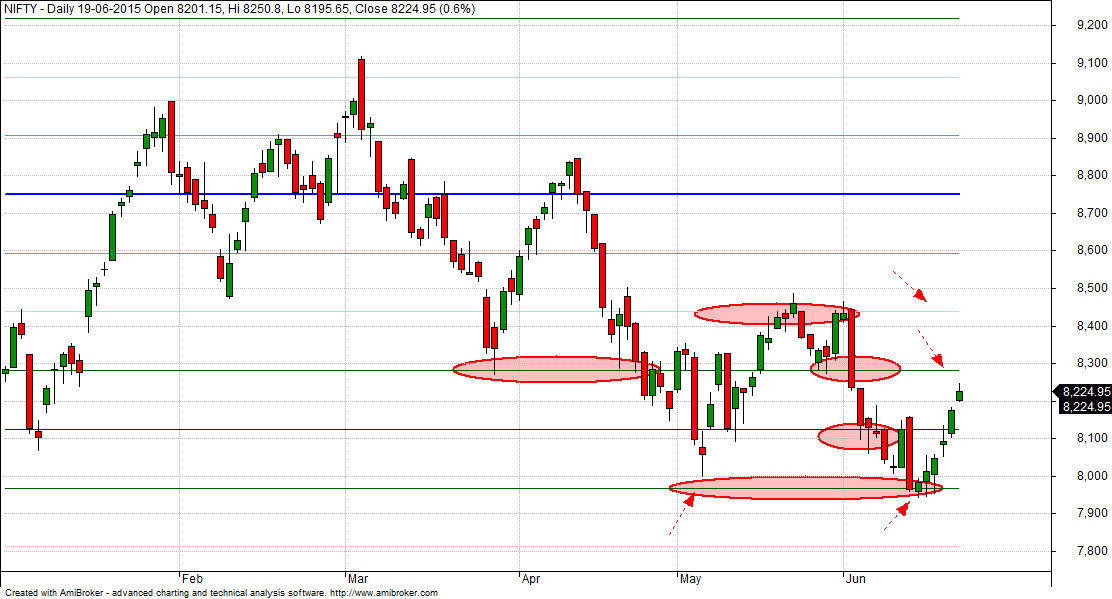
Supply Demand Zone
 Bounced 3 time from Demand zone and once 8351 is crossed big chace of market to rally towards 8432 odd levels in coming days.
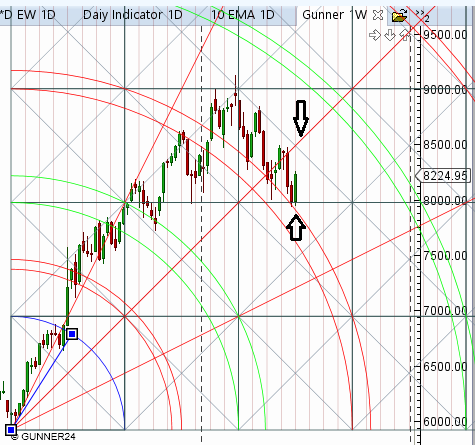
Nifty Gunner

Entering a new quadrant in Gunner with green arcs in vicinity time to be cautious on longs, till zone of 8280/8300 not crossed.
Nifty Harmonic

As discussed last week Nifty has completed the BAT and ABCD pattern on downside. Holding lows can see bullish upside move.
So we were able to capture bottom now on upside as per above chart some profit booking expected in coming week till 8200/8150 either from 8251 or 8280/8300 zone.
Nifty Daily Elliot Wave Chart
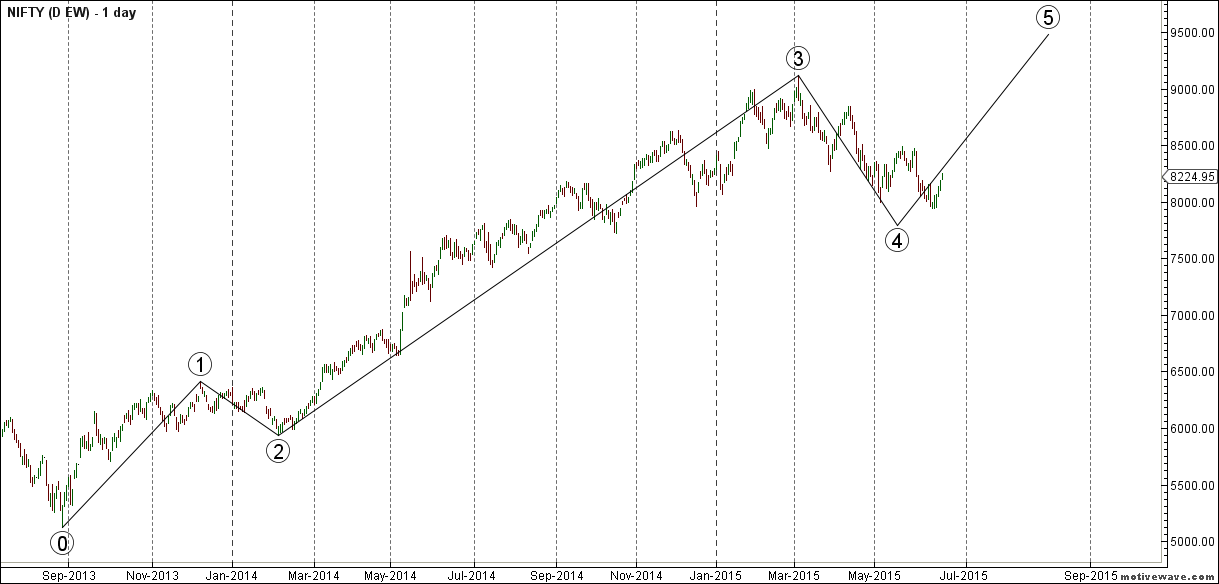
As per EW more legs are left to the rally use dips around 8000/7900 to take exposure to quality large and mid caps stocks. NO leveraged positions this for cash market traders.
Traders who bought must have bee rewarded.
Nifty MML
As discussed last week Unable to cross 7971 short term target 7813. Holding above 8000 short term target 8126/8281.
8283 is MML resistance zone and Support at 8122.
Nifty Gann Date
Nifty As per time analysis 22 June/25 June is Gann Turn date , except a impulsive around this dates. Last week we gave 17 June/20 June Nifty saw a volatile move .
Nifty Gaps
For Nifty traders who follow gap trading there are 15 trade gaps in the range of 7000-9000
- 7067-7014
- 7130-7121
- 7276-7293
- 7229-7239
- 7454-7459
- 7526-7532
- 7598-7568
- 7625-7654
- 7780-7856
- 7927-7940
- 8174-8195
- 8091-8102
- 8262-8271
- 8365-8391
- 8937-8891
Fibonacci technique
Fibonacci fan

Took support @38.2% and bounced back sharply.
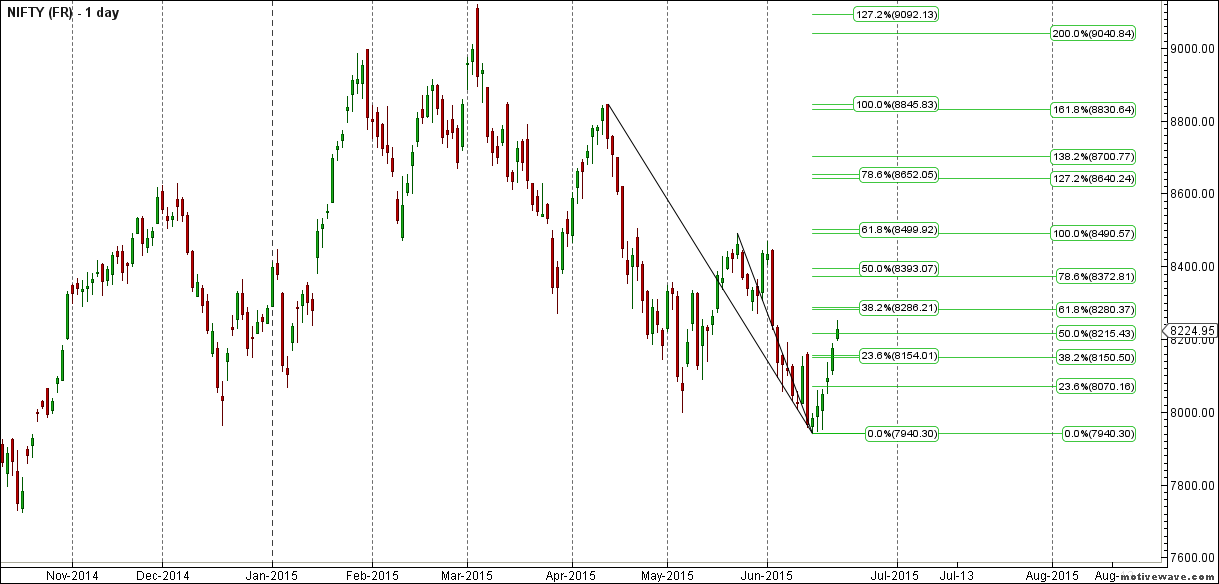
8208-8286 is fibo retracement as shown above are important level to be watched in coming week.
Nifty Weekly Chart
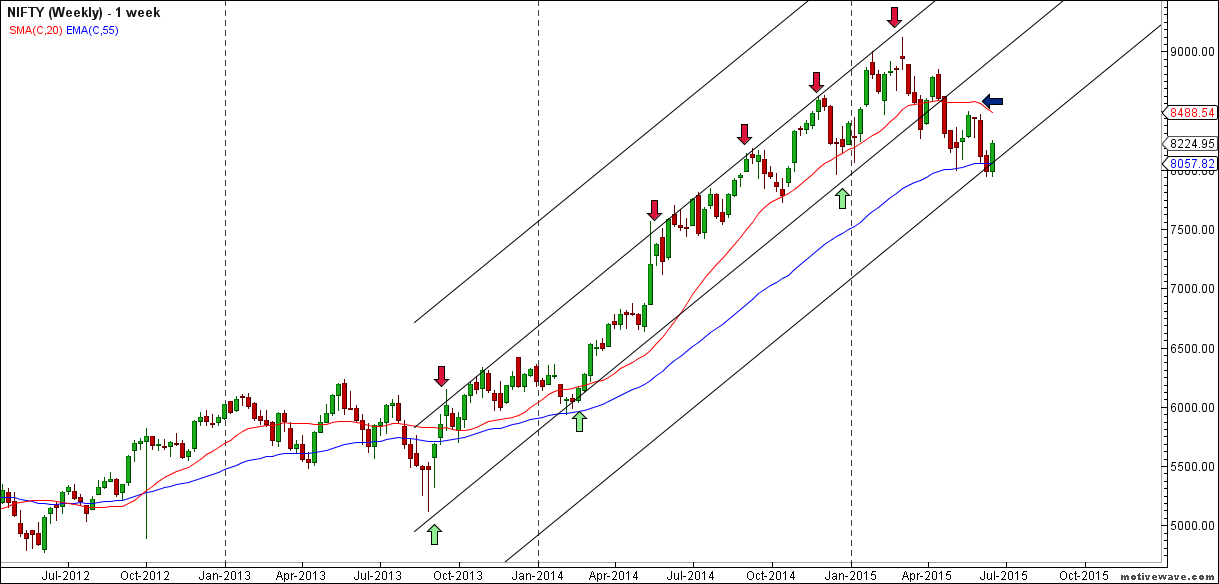
It was positive week, with the Nifty up by 242 points closing @8224 , forming Bullish engulfing pattern and closing above its 55 WEMA and below its 20 WSMA. Nifty has bounced sharply 310 points in past 6 trading sessions based on oversold nature of Weekly chart and positive divergence . As per time analysis next cycle from 22-26 June will be Volatile cycle with underlying trend neutral to bullish. Time Analysis of showing positive move after 14 June worked perfectly

Weekly Gunner
Gunner weekly charts bounced perfectly from red arc and horizontal line and resistance @grey line as shown in above chart.
Trading Monthly charts

Monthly chart recovered back to its 23.6 % retracement.
Nifty PE

Nifty as bounced from 22 PE ratio and move back towards 22.79 zone.
Nifty Weekly Chopad Levels
Nifty Trend Deciding Level:8251
Nifty Resistance:8300,8350,8446
Nifty Support:8200,8156,8070
Levels mentioned are Nifty Spot
Let me go by Disclaimer these are my personal views and trade taken on these observation should be traded with strict Sl.Please also read the detailed Disclaimer mentioned in the Right side of Blog.
Want to see post in your Inbox,Register by adding your email id in Post in your Inbox section
Follow on Facebook during Market Hours: https://www.facebook.com/pages/Brameshs-Tech/140117182685863
Thanks for the analysis. Bullish candle on weekly chart as you rightly pointed out, but wekly supply zone looming close by.
Thank you sir
Bramesh ur daily nifty & weekly nifty forecast using multiple tech analysis is appreciable & useful. U have mastered to put various nifty TA in a capsules form for understanding purpose. So For the coming week from 22 to 26 June it’s very important trading days for the nifty. The benchmark nifty level around 8300 all traders will be having inquisitive( 1) The very first probability niftys will follow the present, only one side trending pattern with out much volatility for crossing 8300 & after the profit booking of long side 8300 will become a good support for crossing next level of 8450. (2) Second probability around the nifty 8300 due to high volatility , as longs & shorts around equally builds up and nifty enters into a consolidation pattern around 8300 before a huge breakout of any side. (3) thirdly and lastly & cautiously (presently chances r less but only in any panic situation like Chinese mkt break down spreading other asain mkts etc.) the benchmark resistance around 8300 could not be overcome smoothly by the bulls & every one starts to book profit from equity stocks to derivatives lots.
Thanks for a nice explanation of all 3 scenarios
Rgds,
Bramesh
Please write an article on HOW TO FIND OVER BOUGHT & OVER SOLD for NIFTY or individual stocks, if possible full technical details….
sure will try to
Rgds,
Bramesh
Hi Sir, can you please suggest any book’s to understand these analysis
Google
Rgds,
Bramesh
Hahahaha! Loved the answer.
But what you said is true, nothing beats this book “Google”
Thank you very much for your detailed analysis. What is the difference between weekly trend deciding level and trend change level in daily analysis? How are we supposed to use both of them?
First get mastery over 1 than move to others.
Rgds,
Bramesh
Excellent as usual. I posted on forums about keeping long above 8224 as this week is somehow is bit complexed one.
Thanks Dada !!
Hi Bramesh,
Thanks for sharing these charts & your views on weekly basis. I am following you from some time & I can clearly see markets are dancing on your tunes – last week was perfect example.
I have few questions on elliot wave chart that you have shared:
1. You have started counting from Sep 2013 (5000) – so is this a medium term chart (only for third wave) or full chart of current bull market. {I am asking because most of the other technical analysts I have seen have started counting this bull run from 2009 lows (2253) & first wave ended in 2010(6357) & second ended in December 2011 (4531)}
2. One of them also hinted that third wave ended at 9000 & there will be a time correction before wave four ends at sub 7300 levels.
I will be really thankful if you can share your views on this.
EW is very subjective in nature and no one is right ot wrong.
Rgds,
Bramesh
highly educative