


On June 11, 2026, the Bank Nifty market exhibited significant volatility, closing up by 71 points within a wide 750-point intraday range. While the index experienced deep intraday swings, the headline figures showed Foreign Institutional Investors (FIIs) remaining net buyers of 1,554 contracts worth ₹258 crore.
Beneath this surface-level buying, the net Open Interest (OI) decreased by 234 contracts. This indicates that while the immediate downward momentum has paused, the market’s initial recovery was heavily driven by position closures rather than aggressive, broad-based new buying.
Decoding the Data: The Mechanics of a Hollow Rally
The headline buying of 1,554 contracts by FIIs hides a tactical de-risking strategy. The futures market witnessed a liquidation of 0.15 Lakh contracts in Bank Nifty June Futures, which stood at a total of 23.8 lakh. Crucially, the increase in the Cost of Carry implies that while there was general profit-taking, strong hands used the volatility to accumulate long positions on dips.
The astrological reason for this behavior is that the market arrived at a critical temporal coordinate of trend maturity, prompting institutional players to cover their short bets. Geopolitical tensions between the US and Iran have shown signs of de-escalation, providing a real-world trigger for a sentiment reset that forced bears to cover their positions.
The net decrease of 234 contracts in Open Interest, occurring alongside a 750-point trading range, indicates a massive battle of position unwinding. Trapped short-sellers who sold into the previous decline were forced to cover their positions, creating immediate upward pressure during the session.
This short-covering action met profit-taking from short-term long holders, resulting in a net contraction of contracts. While the price action managed to close positive, the hollowing out of Open Interest suggests the foundation of the initial bounce is primarily structural and remains vulnerable to pullback.
The Bank Nifty has delivered a structural bounce from its recent lows. This technical reversal was timed by two independent, high-conviction catalysts:
-
The Price Catalyst: The low was made near a key technical support, providing the foundation for the reversal.
-
The Time Catalyst: The turn was triggered by Bayer Rule 6, which indicates a major trend change or bottom is formed when Mars is in 16 degrees 35 minutes of a sign plus 30 degrees.
The astrological reason for this reversal is that Mars reaching 16 degrees 35 minutes of a sign plus 30 degrees marks a point of cyclical exhaustion for the bearish trend, forcing a definitive shift in market energy. This allowed the market to absorb the initial gap-up open and sustain its structure.
The Bullish Mandate: Defending the New Territory
The bears have been temporarily checked, and a potential new trend is attempting to establish itself. The technical landscape has been redrawn, and the bulls must now defend key support zones.
This is the critical, non-negotiable support zone that bulls must defend to maintain control.
-
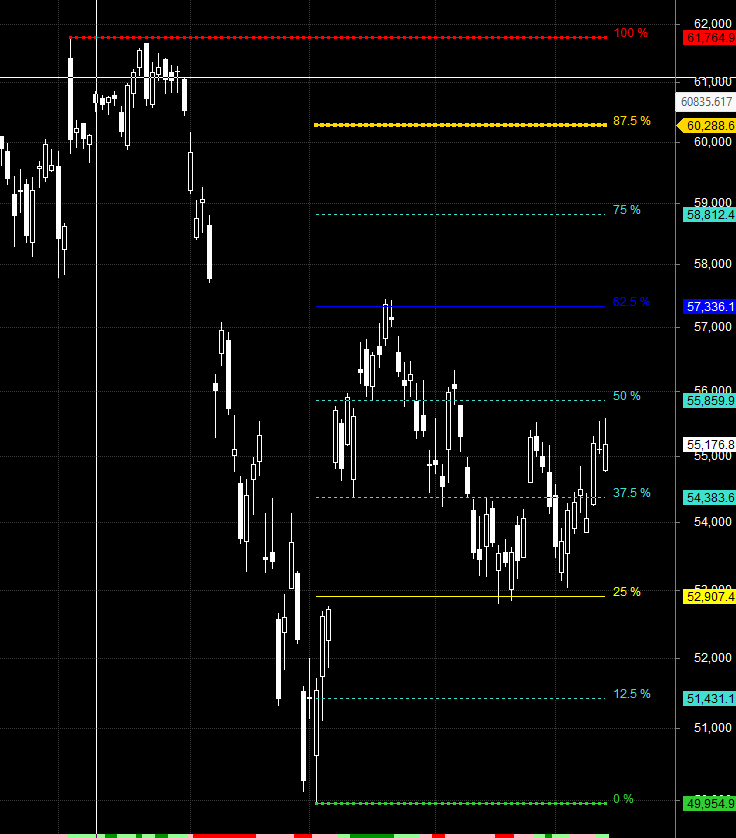
The Condition: IF Bank Nifty holds above the 55,859 level on a sustained basis, THEN the bulls maintain the upper hand, and the momentum has the potential to continue.
-
The Outcome: A successful hold above this structural floor confirms that the capitulatory phase is over, and the rally is poised to target 56,500, 57,000, and 57,336.
The Strategic Objective: The Battle for the Positional Trend
With the weekly close approaching, the bulls have a clear objective to validate this cyclical bottom.
-
The Positional Target: For positional traders, the Bank Nifty Futures’ trend change level is at 54,800. IF the index sustains above this level, THEN it keeps positional traders on the same side as major institutions, offering a favorable risk-reward ratio. The fact that the index closed above its rollover cost of 54,986 is an initial supportive signal.
Conclusion
The battle for the bottom has been initiated at a pre-calculated cyclical low. The immediate path of least resistance is attempting to shift upwards, but the rally must conquer key overhead resistance zones to confirm structural strength.
Traders may watch out for potential intraday reversals at 09:37 AM, 12:36 PM, and 02:19 PM.
-
Bank Nifty June Futures Open Interest Volume stood at 23.8 lakh, with liquidation of 0.15 Lakh contracts. Additionally, the Increase in Cost of Carry implies that there was addition of LONG positions.
-
Bank Nifty Advance Decline Ratio stood at 05:09, and Bank Nifty Rollover Cost is @54986 (closed above it).
Bank Nifty Option Chain Analysis
The Bank Nifty options market is reflecting a neutral-to-cautious undertone. A Put-Call Ratio (PCR) of 0.92 confirms that active sentiment is currently balanced, with put writers attempting to establish a floor.
The market’s immediate center of gravity is anchored at the Max Pain point of 55,000. With the current spot price trading at 55,214, the index is holding just above its point of maximum financial pressure for option buyers.
This setup has forged a clear and well-defended battlefield:
-
Resistance: A formidable wall of Call Open Interest is located at the 56,000 strike, which serves as the immediate psychological and structural ceiling.
-
Support: A powerful support floor has been built by put writers at 55,000, which holds the highest concentration of Put OI.
In conclusion, the Bank Nifty is in a transition phase. The options structure suggests the market is trapped between the support at 55,000 and the resistance at 56,000, requiring a major directional trigger to break the stalemate.
- For Positional Traders, The Bank Nifty Futures’ Trend Change Level is At 54,800. Going Long Or Short Above Or Below This Level Can Help Them Stay On The Same Side As Institutions, With A Higher Risk-reward Ratio.
-
Intraday Traders Can Keep An Eye On 55,288, Which Acts As An Intraday Trend Change Level.
Bank Nifty Spot – Intraday Technical Setup
Technical Setup: The index is currently trading within a defined range. Watch the following pivot zones for potential directional moves:
-
Strength (Upside): IF the index sustains above 55,600, THEN it indicates bullish momentum, and the immediate resistance levels to watch are 55,729, 55,900, and 56,200.
-
Weakness (Downside): Selling pressure is likely to intensify IF the index breaks below 55,176. In this scenario, the next support zones are 55,000, 54,850, and 54,666.
Wishing you good health and trading success as always.As always, prioritize your health and trade with caution.
As always, it’s essential to closely monitor market movements and make informed decisions based on a well-thought-out trading plan and risk management strategy. Market conditions can change rapidly, and it’s crucial to be adaptable and cautious in your approach.
► Join Youtube channel : Click here
► Check out Gann Course Details: W.D. Gann Trading Strategies
► Check out Financial Astrology Course Details: Trading Using Financial Astrology
► Check out Gann Astro Indicators Details: Gann Astro Indicators