


Indian Rupee is trading at 9.5 month low and has given a breakout above 56. Rupee is currently trading at 56.15 and is heading towards its next important resistance of 56.47. Closing Above 56.47 on weekly basis rupee is all heading towards its life high of 57.
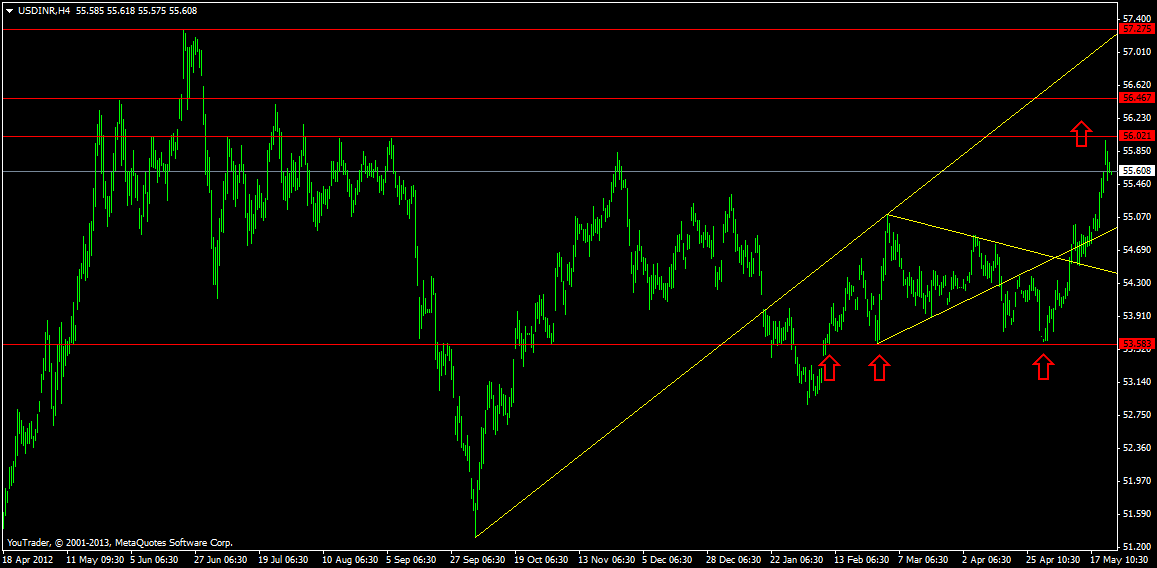
USD INR 4 Hour Chart
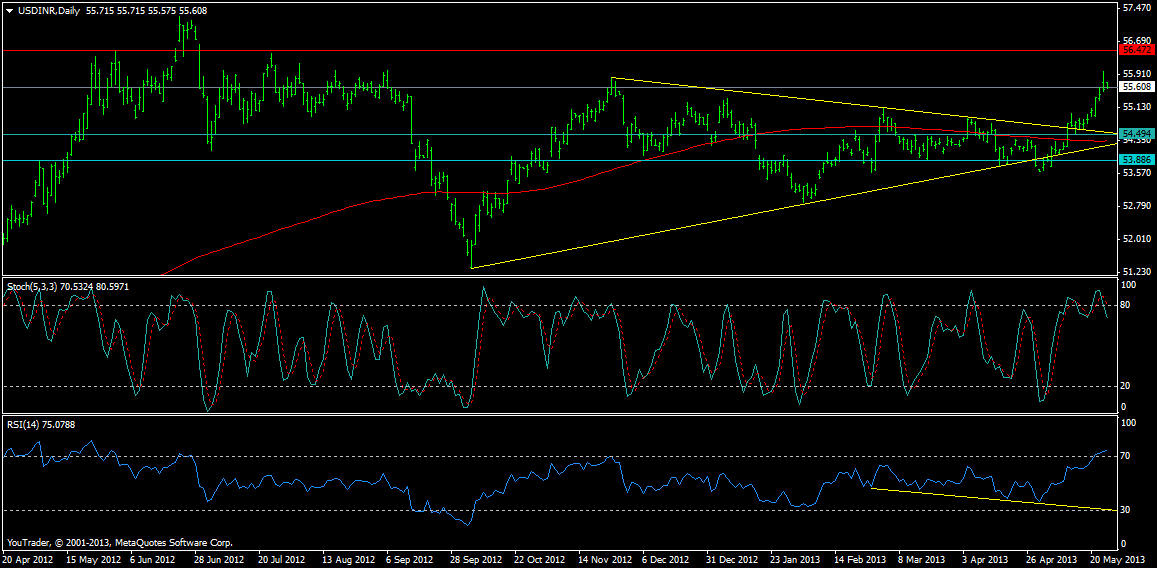
USD INR Daily Chart
As per Daily charts INR has closed above its 200 DMA which is bullish signal. Also it has closed above its symmetrical triangle which again shows a bullish picture. Target for Symmetrical triangle comes at 54.76+(55.84-52.88) =57.72
USD INR Weekly Chart
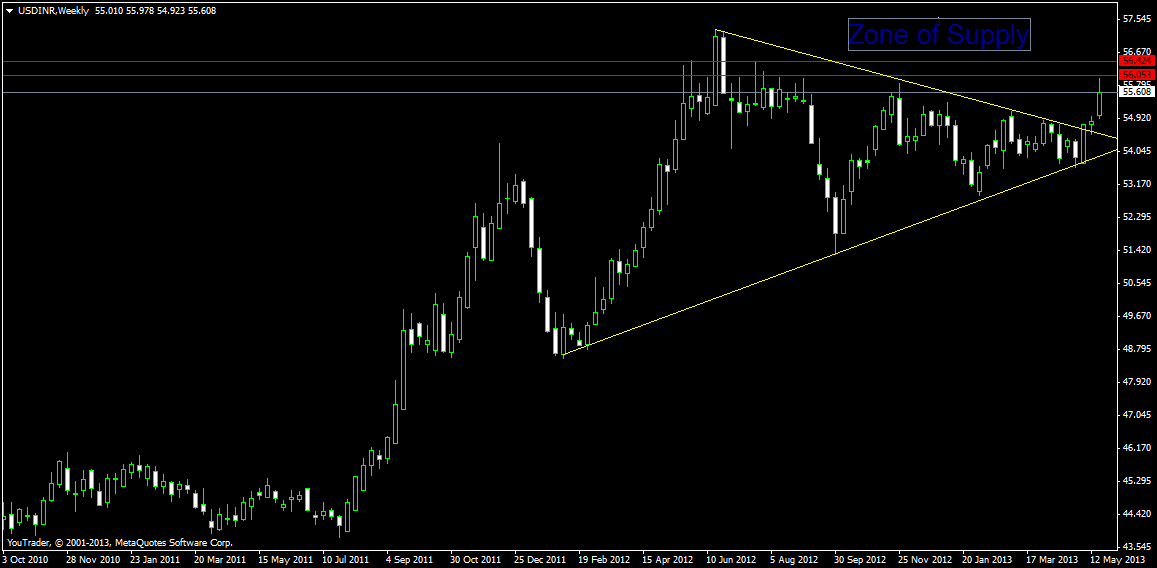
Weekly charts have broken the perfect symmetrical triangle above 54.76 , Closing above 56.4 above which it will make new life highs.
Buy above 56.20 Tgt 56.40,56.75 and 57 SL 56.09
Levels mentioned are USD – INR May Future
Follow on Facebook during Market Hours: http://www.facebook.com/pages/Brameshs-Tech/140117182685863