Nifty Hourly
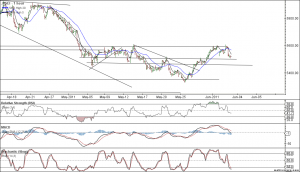
Nifty Hourly Chart as discussed in Previous post 5600 should be crossed and sustained for further upmove. Nifty crossed the levels briefly but was unable to sustain the same.Reliance AGM was a reason for market to correct 😉
5600 becomes psychologically more significant level.
As Seen from Hourly chart on Downside we have support of 5500 and 5461.These levels if sustained can protect the further downside
Nifty Daily
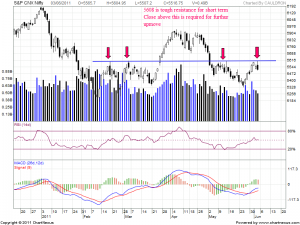
On Daily Chart again as pointed in above chart 5600 is the level to watch out for any further upside in market.
Reliance has sold off from the resistance of 965 once again which is again a Jolt to BULLS.
Nifty Fibo Levels
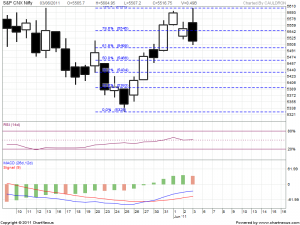
As per fibo levels 5499(61.8% retracement) and 5466(50% retracement) These levels should be watch out for next week and these levels are coinciding with support on hourly charts.
Nifty Short Term Support
20 DMA is a good indicator for short term bullishness or bearishness. As soon as nifty broke 5480 it gave a rally of 120 points,On the same grounds if 20 DMA@5485 breaks on downside Nifty can continue with its downward momentum. So Watch out for 5485 on closing basis.
Nifty Weekly
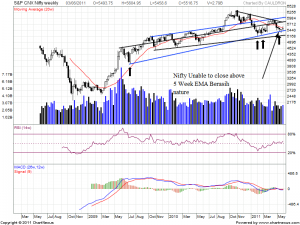
 On Weekly chart the trend lines are maintained and Nifty closed above it. As per weekly chart we are trading in range of 5400-5610 levels.Nifty was unable to close above 5 Week EMA@5553 which gives an upper hand to bears.
Level to Watch
Nifty Trend Deciding Level:5526
Resistance:5610,5673 and 5784
Support:5462,5400 and 5329


