Introduction
The Moving Average is one of the classical and most reliable tool for technical analysis.A Moving Average is an indicator that shows the average value of a security’s price over a period of time. When calculating a moving average, a mathematical analysis of the security’s average value over a predetermined time period is made. As the security’s price changes, its average price moves up or down. Moving averages can be calculated on any data series including a security’s open, high, low, close, volume, or another indicator. The critical element in a moving average is the number of time periods used in calculating the average. The key is to find a moving average that will be consistently profitable.
There are two popular types of moving averages:
- Simple Moving Average (SMA)
- Exponential Moving Average (EMA)
The only significant difference between the EMA and SMA is the weight assigned to the most recent data.
- Simple moving averages apply equal weight to the prices.
- Exponential moving averages apply more weight to recent prices.
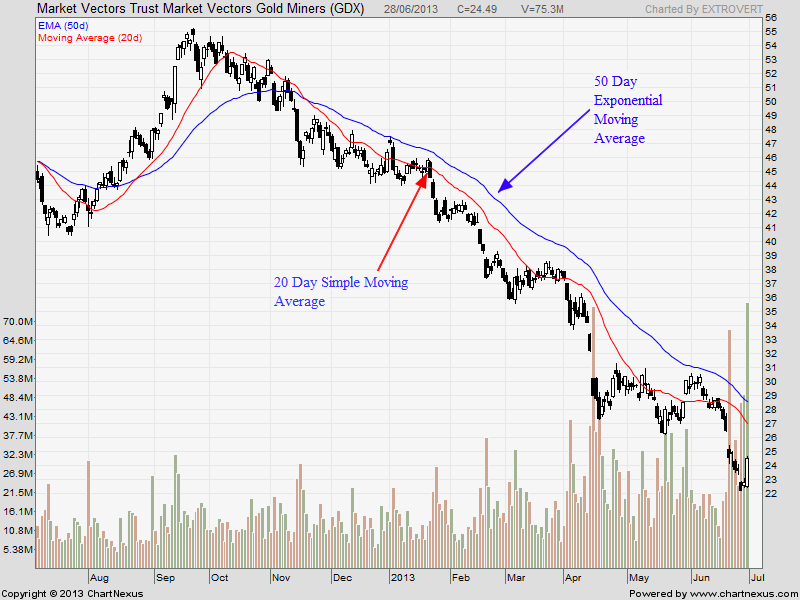
GDX Daily chart is shown below with a 20 Day moving average in red and 50 Day Exponential Moving Average in Blue.
A “Simple” moving average is calculated by adding the security’s price for the most recent “n” time period and then diving by “n”. SMA is lagging moving average.
For Eg. 5-day simple moving average is the five day sum of closing prices divided by five.
Daily Closing Prices: 101,102,103,104,105,106,107
First day of 5-day SMA: (101 + 102 + 103 + 104 + 105) / 5 = 103
Second day of 5-day SMA: (102 + 103 + 104 + 105 + 106) / 5 = 104
Third day of 5-day SMA: (103 + 104 + 105 + 106 + 107) / 5 = 105
In the above example we have shown 5 SMA on daily chart of XOP, Note as SMA is lagging moving average so it do show whipsaw. To avoid whipsaw we use EMA.
Calculation for EMA
“Exponential” moving averages reduce the lag by applying more weight to recent prices. The weighting applied to the most recent price depends on the number of periods in the moving average.
Steps to calculating an exponential moving average:
- Calculate the simple moving average.
- Calculate the weighting multiplier.
- Calculate the exponential moving average.
Lets take an example of how to calculate 5 EMA:
SMA: 5 period sum / 5
Multiplier: (2 / (Time periods + 1) ) = (2 / (5 + 1) ) = 0.33 (33.33%)
EMA: {Close – EMA(previous day)} x multiplier + EMA(previous day).
A 5-period exponential moving average applies an 33.33 % weighting to the most recent price.
Below is an example of a 5-day “SMA” and “ EMA” for Apple. Simple moving averages are calculated as discussed in above example. The exponential moving average starts with the simple moving average value 449.61 in the first calculation. After the first calculation, the EMA formulae as discussed above will take effect.
| Date | Close Price | 5 SMA | Multiplier | 5 EMA |
| 25-01-2012 | 446.66 | |||
| 26-01-2012 | 444.63 | |||
| 27-01-2012 | 447.28 | |||
| 30-01-2012 | 453.01 | |||
| 31-01-2012 | 456.48 | 449.61 | 449.61 | |
| 01-02-2012 | 456.19 | 451.52 | 0.33 | 451.80 |
| 02-02-2012 | 455.12 | 453.62 | 0.33 | 452.91 |
| 03-02-2012 | 459.68 | 456.10 | 0.33 | 455.17 |
| 06-02-2012 | 463.97 | 458.29 | 0.33 | 458.10 |
| 07-02-2012 | 468.83 | 460.76 | 0.33 | 461.68 |
| 08-02-2012 | 476.68 | 464.86 | 0.33 | 466.68 |
| 09-02-2012 | 493.17 | 472.47 | 0.33 | 475.51 |
| 10-02-2012 | 493.42 | 479.21 | 0.33 | 481.48 |
| 13-02-2012 | 502.60 | 486.94 | 0.33 | 488.52 |
As EMA gives more weight to recent price action whipsaws are quiet less. As seen in above example Apple just kept trading above its 5 EMA in the uptrend which started in January 2012.
To be Continued


Are EMA Periods Changes for Positional & IntraDay Charts?
Nope
What are the five best periods for EMA?
5 8 13 21 34