


IRB

Positional Traders can use the below mentioned levels
Close above 221 Tgt 228/233
Intraday Traders can use the below mentioned levels
Buy above 221 Tgt 223.5,227 and 230 SL 220
Sell below 219 Tgt 217.8,215.7 and 213 SL 220
SUN TV
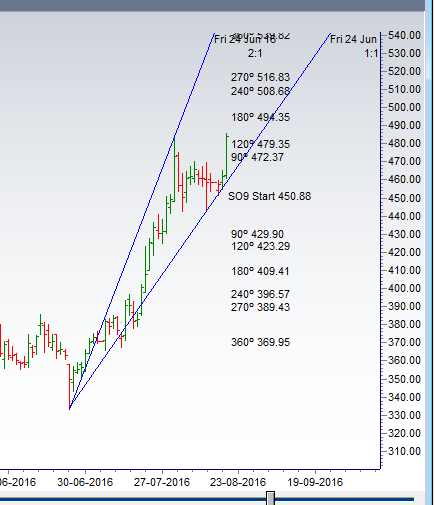
Positional Traders can use the below mentioned levels
Close above 494 Tgt 508/516
Intraday Traders can use the below mentioned levels
Buy above 486 Tgt 490 ,494 and 498 SL 484.5
Sell below 482.8 Tgt 477.8,472.7 and 468 SL 484
Glenmark

Positional Traders can use the below mentioned levels
Close above 878 Tgt 897/907
Intraday Traders can use the below mentioned levels
Buy above 874 Tgt 878 ,884 and 893 SL 870
Sell below 868.8 Tgt 863.8,855.7 and 848 SL 872
How to trade Intraday and Positional Stocks Analysis — Click on this link
Performance sheet for Intraday and Positional is updated for July Month, Intraday Profit of 3.57 Lakh and Positional Profit of 4.79 Lakh. Please note we do not have any “ADVISORY Service”, I share this sheet to see how the system are performing and money can be made in Stock Market if System are followed with discipline. Also the performance differs from trader to trader.
http://tradingsystemperformance.blogspot.in/
http://stockpositionaltrading.blogspot.in/
- All prices relate to the NSE Spot/Cash Market
- Calls are based on the previous trading day’s price activity.
- Intraday call is valid for the next trading session only unless otherwise mentioned.
- Stop-loss levels are given so that there is a level below/above, which the market will tell us that the call has gone wrong. Stop-loss is an essential risk control mechanism; it should always be there.
- Book, at least, part profits when the prices reach their targets; if you continue to hold on to positions then use trailing stops to lock in your profits.
Follow on Facebook during Market Hours: https://www.facebook.com/pages/Bramesh
Dear Sir,
A very good evening
I was wondering can all the calls on stock need different analysis chart or any one analysis hold good for all the stock like 21EMA wih 5min.
I’m actually still confused about when to take a buy call.Today i just tried on paper to do a sell call when irb price was at 228 based on resistance data which i calculated using 18th data from web using pivot calculation but it rather rallied till 232 which i fixed as SL.
Can i have some guidance on this.