
Last week we gave Chopad Levels of 8286 Nifty did 3 target on upside and 1 target on downside. Watch out For ECB, World Economic Forum & China GDP for coming week, expect big round of volatility. Lets see how to trade nifty in coming week.
Nifty Hourly Chart
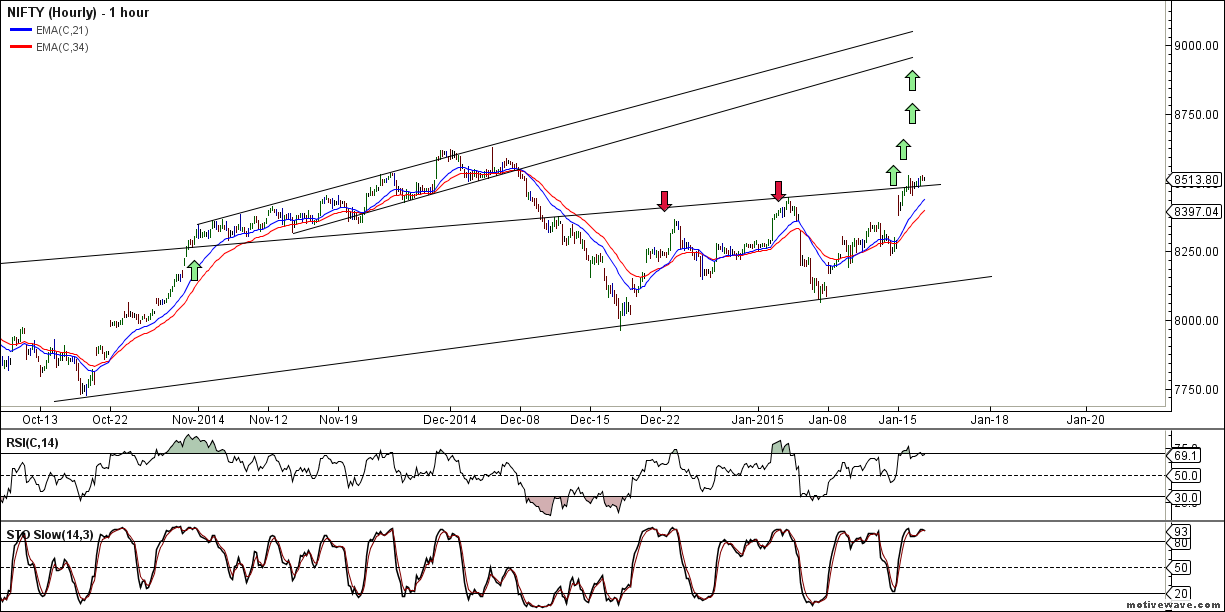
Nifty Hourly charts has broken above the trendline resistance signalling move towards new high, Any correction new the trendline support will give a good opportunity to go long.
Nifty Hourly Elliot Wave Chart
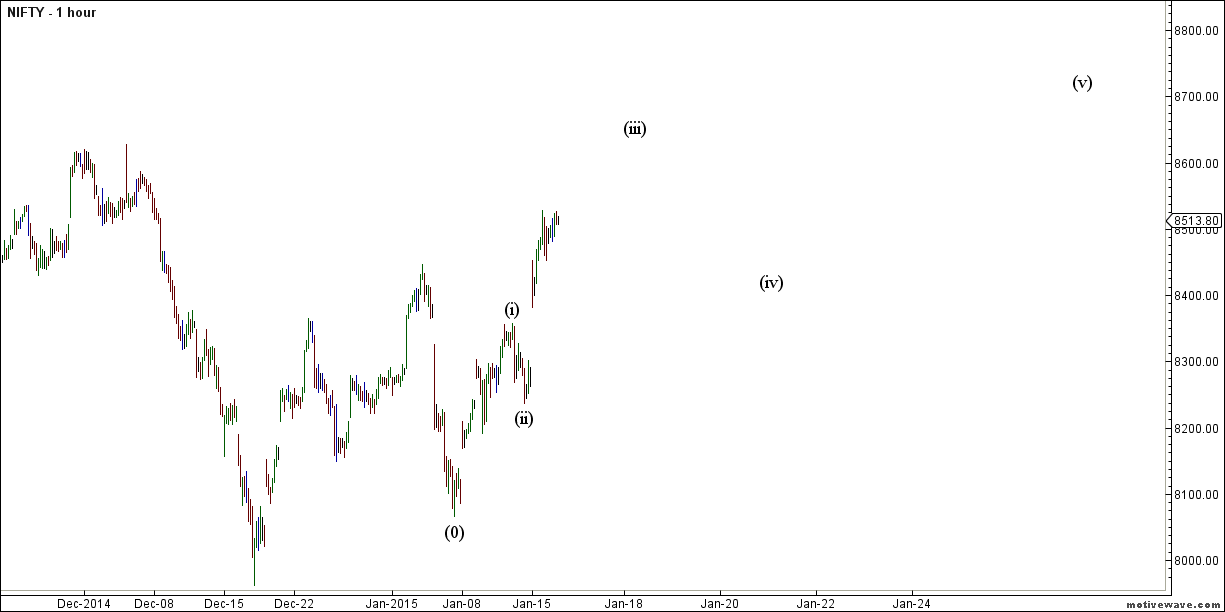
Elliot wave chart on Hourly is shown above suggesting upmove can continue further and 8620/8660 will decide further course of action.
Nifty Daily Chart
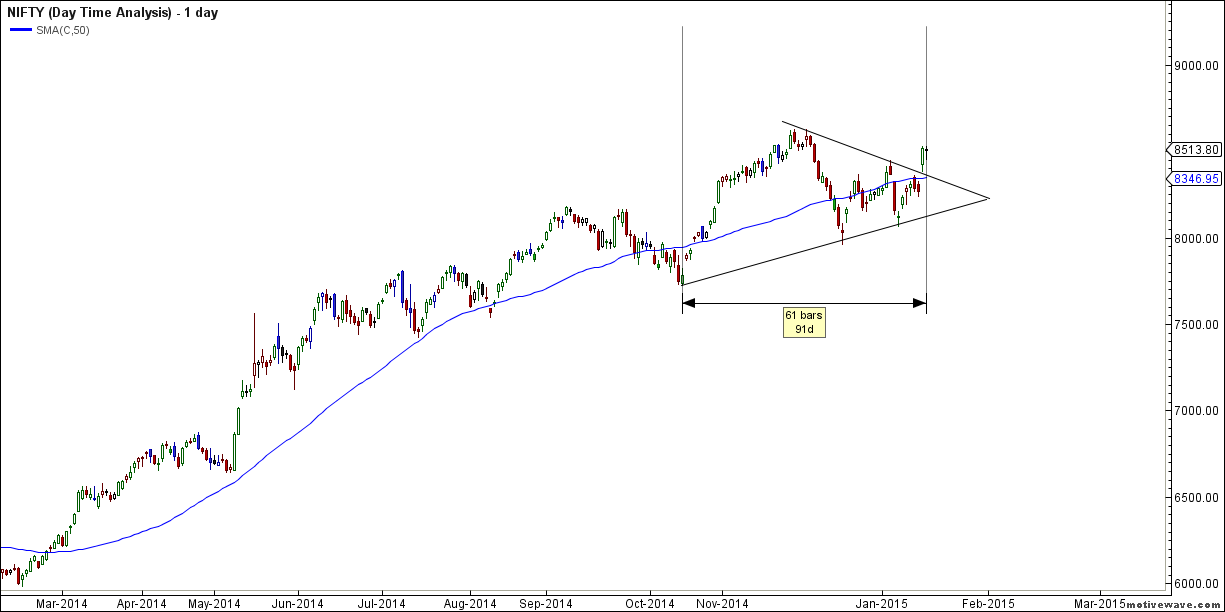
This is what we discussed last week Nifty daily chart has completed 56 trading days from the low formed on 17-Oct, as per gann theory next week will be very crucial as per time theory, Also Nifty for 3 time has taken support near 100 DMA also forming triangle formation with breakout, breakdown offing in coming week. So Gann effect was seen with big rise on 15 Jan and we have seen the triangle breakout. Target of Triangle breakout comes @9147.
Nifty Harmonic Pattern
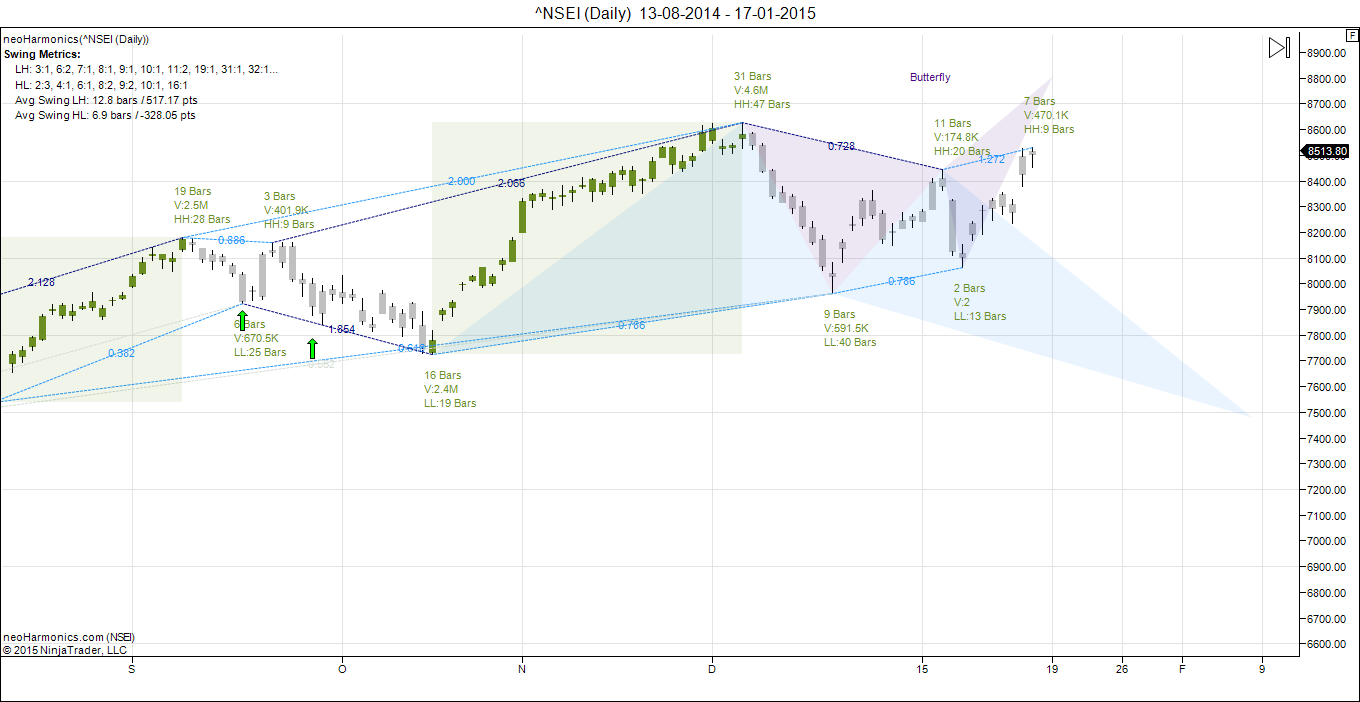
As per Butterfly harmonic pattern nifty is heading towards new high by Feb holding 7961. As discussed in last week analysis nifty is on target of reaching new high.
Nifty Daily Elliot Wave Chart
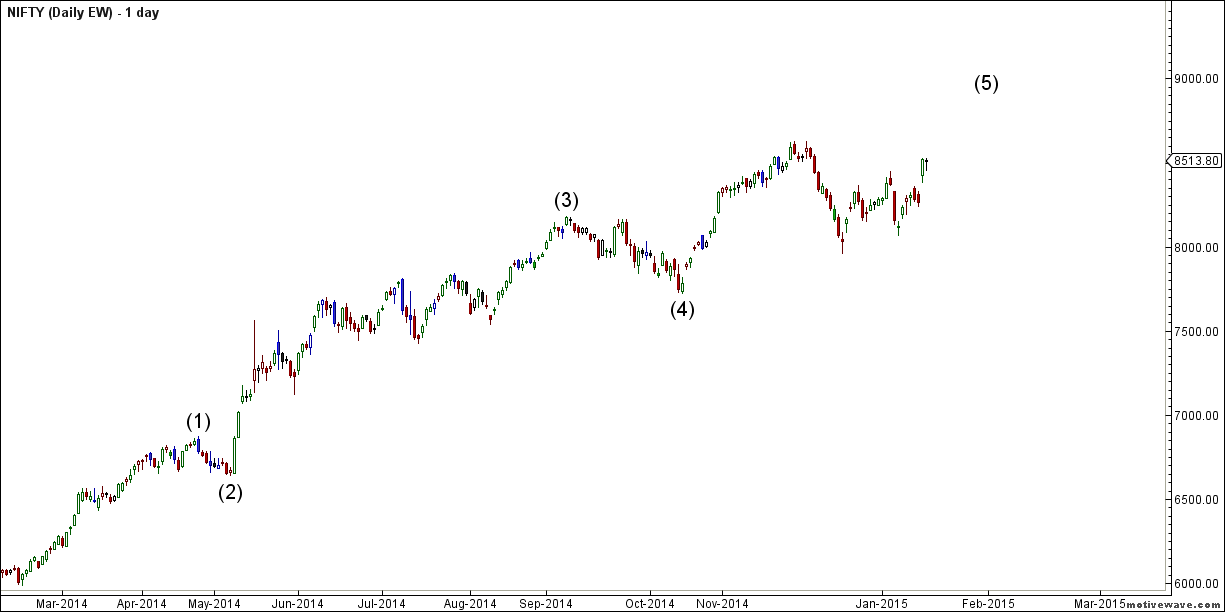
As per EW more legs are left to the rally use dips to take exposure to quality large and mid caps stocks.
Nifty Gann Date
Nifty As per time analysis 21 Jan +-1 day is Gann Turn date , except a impulsive around this date. Last week we gave 12 Jan and Nifty saw 100 points volatility on that day.
Nifty Gann Emblem
16 Jan are very important date as per Gann Emblem. RBI news came 1 day before the gann emblem date Next important day to keep in mind is 16 Feb.
Nifty Gaps
For Nifty traders who follow gap trading there are 7 trade gaps in the range of 7000-7800
- 7067-7014
- 7130-7121
- 7276-7293
- 7229-7239
- 7454-7459
- 7526-7532
- 7598-7568
- 7625-7654
- 7780-7856
- 7927-7974
- 8029-8065
- 8378-8327
- 8102-8167
- 8277-8380
Fibonacci technique
Fibonacci fan

Nifty took exact resistance @ gann fan once broken above it will move in next quadrant.
Nifty Weekly Chart
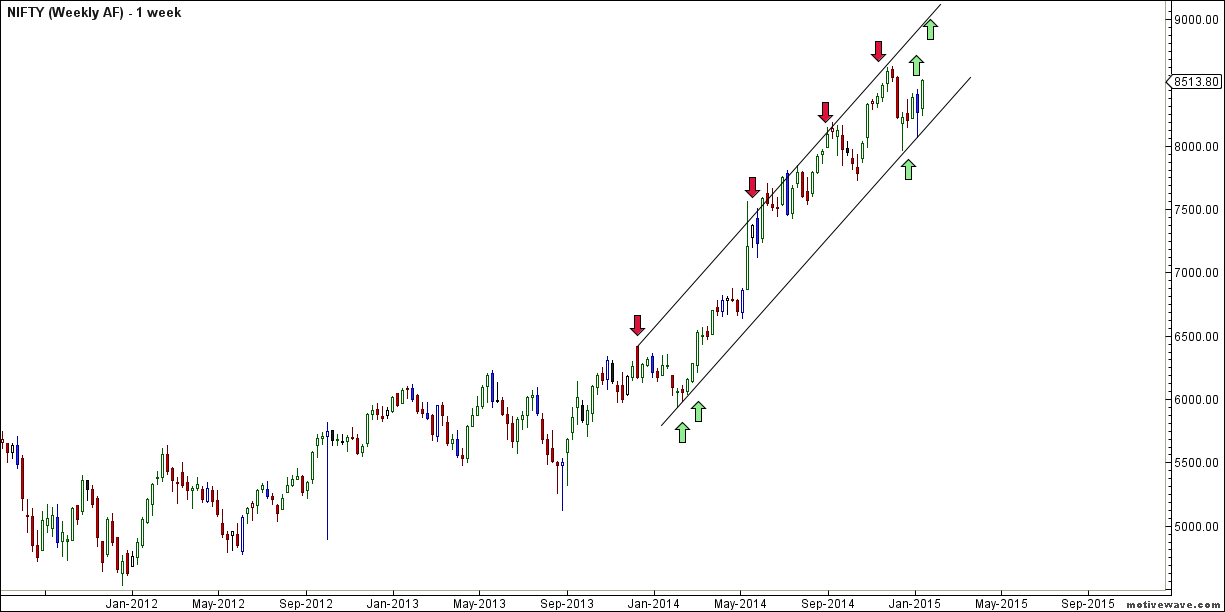
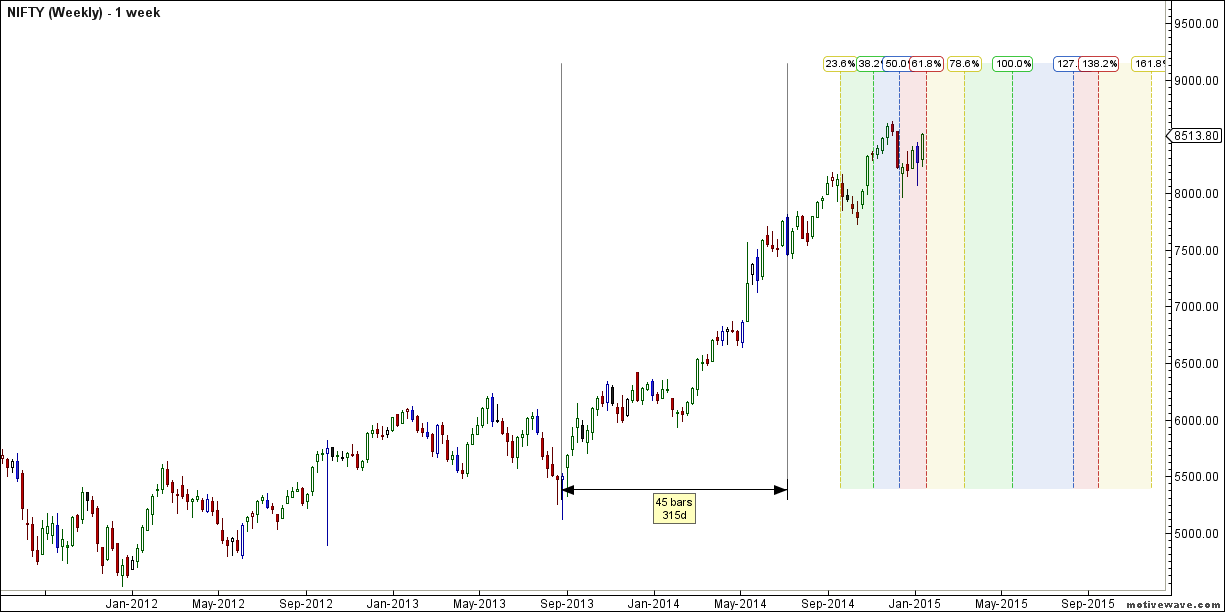
It was positive week, with the Nifty up by 229 points closing @8514 and trading in its uptrending channel . Weekly time cycle will start in new quadrant in coming week, so exciting times ahead.
Trading Monthly charts
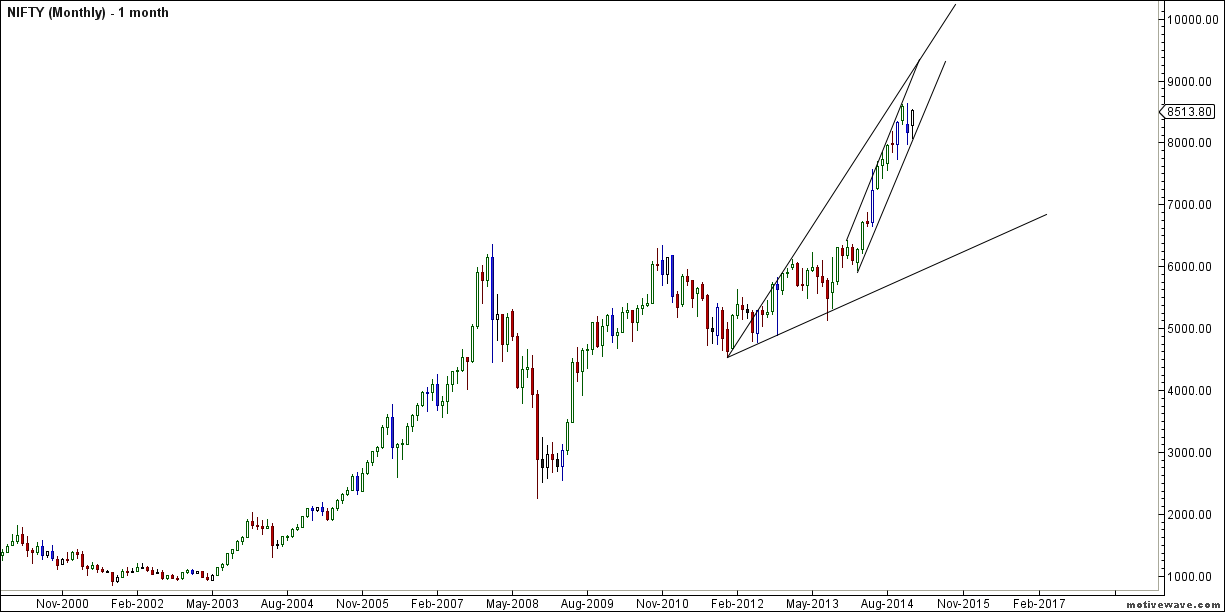
Uptrending Monthly channel is still on, so new highs can still come.
Nifty Weekly Chopad Levels
Nifty Trend Deciding Level:8556
Nifty Resistance:8620,8680,8757
Nifty Support:8500,8427,8380
Levels mentioned are Nifty Spot
Let me go by Disclaimer these are my personal views and trade taken on these observation should be traded with strict Sl.Please also read the detailed Disclaimer mentioned in the Right side of Blog.
Want to see post in your Inbox,Register by adding your email id in Post in your Inbox section
Follow on Facebook during Market Hours: https://www.facebook.com/pages/Brameshs-Tech/140117182685863


Brahmesh Garu, I stumbled into your site recently.Hats -off for your sugestions and Gann dates.Today was spectacular. Thank-you.Your helping others will help you !
Thanks a lot !!
Looking at NIFTY crossing 8700 today, can we say that your statement “As per time analysis 21 Jan +-1 day is Gann Turn date , except a impulsive around this date.” has come true?
yes sir gann showed its effect
Tomorrow is amavasya day , so impulsive move is more likely as you have mentioned +- 1 day of jan 21 , let us watch tomorrow for this coincidence
Bramesh.. Excellent info
Thank you sir
again excellent analysis sir
Dear Mr. Bhandari,
You are doing an excellent community service in educating the group members. I also do the Technical analysis ( not as deep as you) and also Astro. My brief background is as follows. Ph. D. (Organic Chemistry), Post-Doc In US for 3 years in Biochemistry, 30 years experience in Pharma Process Development R & D. Now retired and settled at Kolhapur and actively trading.
Can we be friends? If yes, please provide your contact nos.
Warm regards,
Dr. Suhas Sohani
Hai Dr suhas am prof in engineering college now into trading, am glad to know you are doing technical analysis if you dont mind may i know what are the data’s you are using in analysis and the sources for data is it from nse web site.
i get some data from my local news paper
Bramesh provides only FII data this may be more then enough as it is the FII’s who control the Indian market,sometimes DII data also gives clues about market direction for example in dec series after 666 points due to heavy selling by FII’s , DII’s pulled back the market by nearly 300 points
now for monday am expecting bullish trend as FII’s are little bullish and DII’s are more bullish as they have more shorts in PUT’s
please share the web link that you are using for data or any other matter.
with warm regards
Sir
Does your training course help the student himself to identify weekly chopad levels for Indices and stocks ? Pl advise.
Thanks
SN
Sir, Good Morning,
You have said that “Next important day to keep in mind is 12 march.” What about 16th Feb before that day? Sir, I request you to please explain in a separate article how to read a GANN EMBLEM & also GANN SEASONAL TIME THEORY.
Regards.
CA. Prakash Tanak