


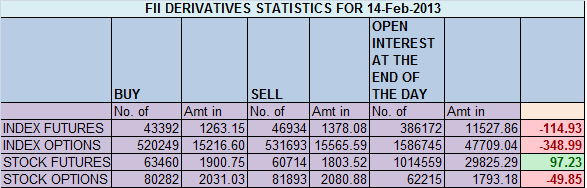
- FIIs sold 3542 contracts of Index Future worth 114 (1592 Long contracts were squared off and 1950 short contract were added ) with net Open Interest increasing by 358 contracts, so FII’s added shorts in index future before vote of account.
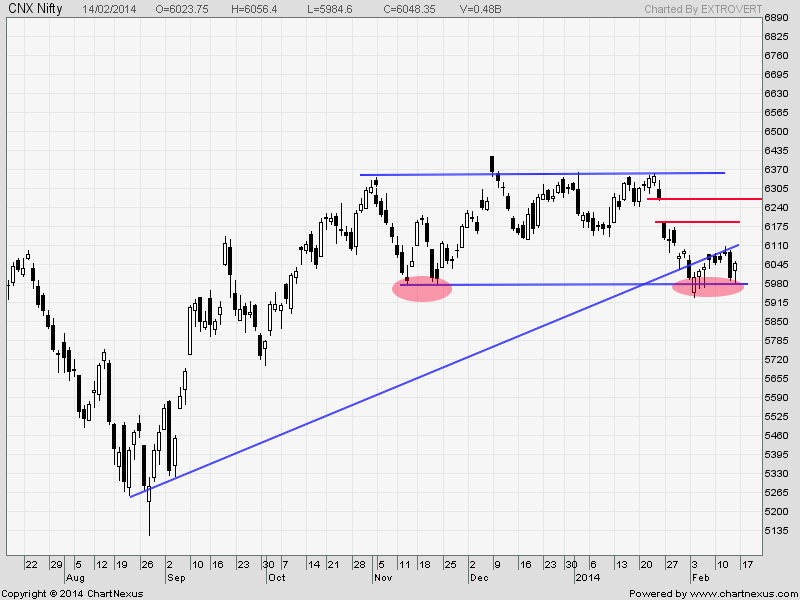
- Yesterday we had discussion Nifty is entering now in demand zone of 5970-5950 which if held we can see a bounce back. Market is trading in range of 6100-5950. Market reacted very fast as soon as it entered the range and closed at 6048. We have vote on account on Monday which will increase volatility. We have formed Piercing Pattern today.A piercing pattern can serve as an indicator that it is time to either buy a stock or close out short positions because the stock may be trending upward soon. It should not, however, be used as a stand-alone indicator, but should be compared against other bullish and bearish indicators.
- Nifty Future Feb Open Interest Volume is at 1.62 cores with liquidation of 4.5 lakhs in Open Interest,so liquidation of shorts with increase in cost of carry.
- Total Future & Option trading volume at 1.53 lakh with total contract traded at 2.2 lakh, cash market volume were below average suggesting today rally was based on short covering,PCR (Put to Call Ratio) at 1 signalling neutral zone.
- 6200 Nifty CE is having highest OI at 63.2 lakhs , remain resistance for the series,6100 CE liquidated 8.3 Lakhs suggesting bulls are back with bang and monday we should see close above 6100 ,6300 CE added 1.1 Lakh in OI.As discussed yesterday 6000 CE added huge 12.5 lakh in OI suggesting bears want to capture 6000 and do a weekly closing below 6000 but OI is less so bounce back chances are more. 5700-6300 CE liquidated 17.1 Lakh in OI.FII’s bought 1.5 K contract of CE mostly in 6300 and 6400 CE and 4.1 K were shorted.
- 6000 PE is having highest OI at 87.1 lakhs, so base at 6000 looks strong and has again acted as strong support. 6100 PE liquidated 2.7 lakhs,having OI at 35.8 lakhs, suggesting liquidation has started. 5700-6300 CE liquidated 12.7 Lakh in OI .FII’s sold 1.5 K contract of PE and 5.7 K PE shorted were covered.
- FIIs sold 15 cores in Equity ,and DII sold 45 cores in cash segment.INR closed at 61.92
- Nifty Futures Trend Deciding level is 6030 (For Intraday Traders). NF Trend Changer Level (Positional Traders) 6060 and BNF Trend Changer Level (Positional Traders) 10241.How to trade Nifty Futures and Bank Nifty Futures as per Trend Changer Level .
Buy above 6056 Tgt 6075,6094 and 6120(Nifty Spot Levels)
Sell below 6030 Tgt 6003,5985 and 5970 (Nifty Spot Levels)
Live Nifty A/D charts Click on the Link
Traders who use Pivot and Camarilla can use the following 2 sites for Hourly values and EOD values
http://camarillapivotpoints.blogspot.com/
http://niftystockpivot.blogspot.in/
for d time being we have a bottom. nifty to revisit 6289 by expiry and den from march – may bears will rule d world for may be one last time dis year n july onwards we l have a bull market. . ………IT TELECOM CHEMICALS ARE ALL GOING TO SHOOT DEN…….
thank you su for the explanation
Hi Janak,
I was just pointing out the pattern in question.
Nifty is in a short term downtrend. The index had a even better classical Hammer on 30th Jan (close 6073.7). Then we had one small up day after which the Index broke 200dma (Intra-Day though).
We had a Dragonfly Doji (or a Hammer) in the last weekly candle (week ended 7th Feb) but the last week 10th – 14th Feb was nothing great for bulls.
One can even suggest yesterday’s candlestick as a bullish Harami which suggests the preceding trend may stall (or take a breather) and not necessarily reverse. It is just a warning for the Bears.
Su – thnx for that insight. What follows the “hammer” generally?
Dear Sir,
Good day to you.
Well, yesterday’s (14th Feb) Nifty Candlestick is certainly not a “Piercing pattern” it is more of a Hammer.
For a Piercing pattern, we should have a Opening “below the low of the previous day” which was not case.
Piercing pattern signals a complete bull day which opens gap down and closes at least 50% into the body of the previous black candle.
Yesterday was more like a “Hammer”. In a downtrend, small real body at the top, tail more than two times the real body, very small upper shadow.
Correct me if I am wrong.
thnx bramesh – so bears will give up this easily after holding for half the series? or again an assault after visiting 6110 zone like last week?
thnx bramesh.
What i wish to know that after such a day – when the mkt reopens on monday – will there be a revisit to the 5975-6025 zone? a gap of 20-30 pts looks like.
Hi Janak,
Nope 5985 is low of yesterday visiting 5975 invalidates the pattern.
Rgds,
Bramesh
Great Reaserch and great Support to Retail Trader !!!Thanks Brameshji !!
Thanks Uttamji,
Rgds,
Bramesh