Last Week was the most volatile week in recent trading history with Nifty swinging wildly in range of 750 points and ending the week on flat note. Nifty was falling Against the backdrop of a falling rupee, FII selling and the passage of food security bill in the Parliament accentuated the selling pressure.
GDP growth dived to a four-year low of 4.4 per cent in the April-June quarter of 2013-14, against 4.8 per cent in the fourth quarter of the previous financial year. INR touched an all-time low of Rs68.75 to the dollar and Petrol and Diesel prices raised from today.
US markets will be closed on Monday for the Labor Day holiday
Last week we gave Trend Deciding level as 5508 Nifty Nifty achieved all 3 target on downside :).Lets analyze how to trade Nifty in Expiry Week.
Nifty Hourly Chart
Nifty Hourly charts is trading in perfect downtrending channel and breakout comes above 5484.
Nifty Gaps
For Nifty traders who follow gap trading there are 1 trade gaps in the range of 5400-6000 and all other gaps got filled.
- 5742-5716
Nifty Daily Chart
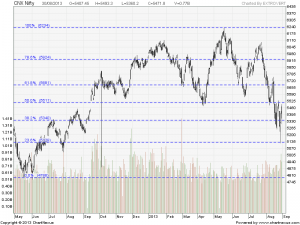
Nifty Spot bounced smartly from 5119 falling trendline support as shown in below chart and bounced back to retest the previous support (which is now a huge resistance) 5477.Another breakdown point of 5505 will act as resistance in coming week.
Fibonacci technique
As per of Fibo Retracement theory Nifty has taken resistance at 50% retracement and support at 23.6% bounced above it as shown in above chart. Holding above 5511 bounce till 5664 can be seen.
Fibonacci fan
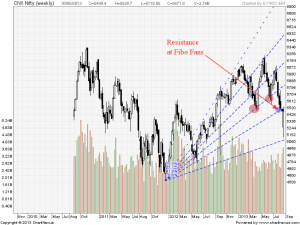
Nifty Fibonacci fan are wonderful tool to find the top and bottom in short term.The above chart is self explanatory
As per Nifty Chopad levels close above 5475 will only be a booster for Bulls. Last week Nifty Chopad level of 5296/5166 played the trick as we were able to capture the bottom and participate in upward rally also.
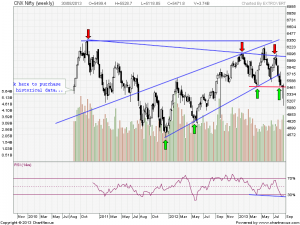
Nifty Weekly Chart
Trading Monthly charts
Monthly charts have given a breakdown. Will we see a follow up action in September month ?
Nifty Trading Levels
Nifty Trend Deciding Level:5508
Nifty Resistance:5556,5605 and 5660
Nifty Support:5426,5375 and 5296
Levels mentioned are Nifty Spot
Stock Performance sheet for June Month is updated on http://tradingsystemperformance.blogspot.in/
Let me go by Disclaimer these are my personal views and trade taken on these observation should be traded with strict Sl
Want to see post in your Inbox,Register by adding your email id in Post in your Inbox section
Follow on Facebook during Market Hours: https://www.facebook.com/pages/Brameshs-Tech/140117182685863


