
Nifty continued its dream run with another 2.3% upmove for the previous week. FII has bought equities worth 4691 cores on first 3 days on February, which lead to Nifty moving above the 200 DMA.
Trend Deciding level 5205 gave good trade to positional traders as per Last Weekly Analysis
Are we out of Woods looking the the dollar inflow we saw I guess not as still MACRO problem persists. Core sector grew a tepid 3.1% in December, and credit offtake for calendar 2011 almost halved to 15.2%. On the positive side, the HSBC Purchasing Managers’ Index (PMI), a sentiment indicator, climbed to a seven-month high of 57.5 in January.
So now everybody is asking are we in Bull market or this is one of the sharp and swift bear market rally?
As a Technical Analyst there are basic 4 Criteria to define Bull and Bear Market
1. Trading above 200 SMA — It has been 3 days Nifty has been trading above 200 SMA . Condition Met
2. 200 SMA should trade below 50 SMA which is still not met.As shown in below chart 200 SMA is trading above 50 SMA.Condition Still not Met
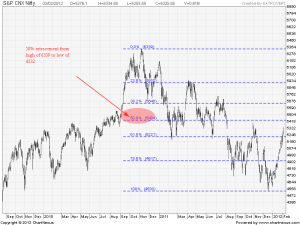
3. Bull markets are defined when Index reaches 20% from Bottom ie, Low of nifty was 4532. Now 20% from this level comes at 5438 (4532+906). On this we will get more indication next week. Condition Still not Met
4. :Last condition Index should retrace the 50% fall from the highs. ie From High of 6338 to low of 4532 Nifty should retrace 50% which also comes at 5437. Condition Still not met.
So from the above we can conclude still its early days to say we are in Bull market.
Keep close eve in the range of 5400-5450
Nifty Hourly Day Chart
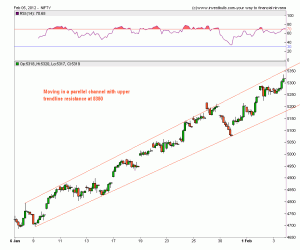
On Hourly charts shown above i have pointed all the 4 Gaps which have been left unfulfilled from the rise of 4640-5326 on Nifty Spot. For a healthy rising markets such gaps needs to be filled as it can be considered as VOID left in a newly constructed building. Gaps will get filled in next downleg of Nifty most probably in February.
1 Gap :4641-4676
2 Gap:4744-4772
3 Gap:4879-4905
4 Gap:4947-4991
Keep watch on above levels as Gap provides an excellent trading opportunities.
Nifty Daily Chart
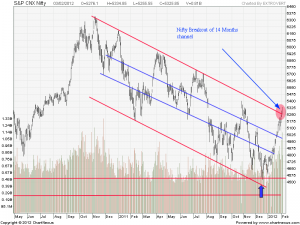 Nifty did a breakout out of 14 months channel which is a bullish signs and much talked about . When a particular things comes in public knowledge markets do give a whipsaws to trap traders . So we will look for confirmation with a weekly closing above breakout level of 5250.
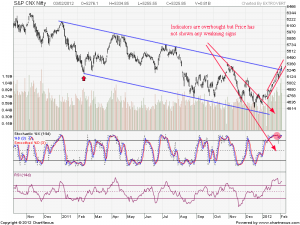
Indicators can remain oversold for extended period of time Check the above chart. Wait for Price to show weakness before taking any short trade.
Do not be courageous to take shorts without any confirmation . Either be with trend or stay out of market.
Nifty Weekly Chart
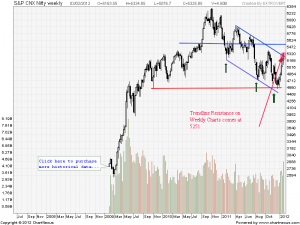
Breakout in Weekly charts as we discussed in last week analysis. 5450 and 5555 are the next level of resistance on weekly charts.Volumes are highest in preceding weeks signifying the breakout backed by volumes.
Nifty Monthly Chart
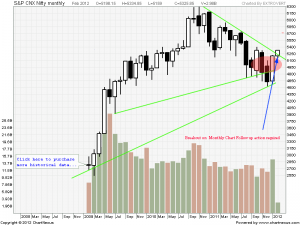
Nifty Trend Deciding Level: 5350
Nifty Resistance: 5400,5445,5504 and 5550
Nifty Support: 5285,5225,5160 and 5120


Hi sir, Iam new to your SITE &fallowing it from past one week. It is giving me lot of knowladge & confidence. REGARDS.
Dear Sir,
Am happy to know that Site views are helping you in your trading
Rgds,
Bramesh
lovely analysis !!! Wonderful.
Thanks a lot Mridu Sir
Rgds,
Bramesh
Excellent analysis.Well balanced view.
Thanks a lot Arora Sir
Rgds,
Bramesh
Dear Sir
Please teel me how to download Ambibroker free software. Yesterday I searched in Google website, but I could not download the same.
Please mail the procedure for download software
Regards
B. Chandra Shekar
Mobile: 9845351704
Dear Sir,
I do not use amibroker so will not be able to help you on this aspect.
Rgds,
Bramesh
I think market will only entered into the Bull Market if Fundamentals supports it and at present there is no sign of it except average results and PMI numbers.
After yesterday’s results of teleconference between troika and Greece, conditions doesn’t looks healthy now. Be cautious about going long for next two days.First lets see how Greek politicians come with a consensus on reforms by Monday. This will show light on where to go.
But certainly don’t Short for next two days.
Dear Sir,
Stock Market moves in 6 months advance cycle when the news and data about fundamentals of economy will come to general public till than we will have the market already discounting the news.
Greece news can be a reason market needs to correct lets see how it pans out.
Rgds,
Bramesh
Dear Bramesh,
Nifty is making new highs but RSI is not doing the same, does it signify anything important? (KPL mentioned in his blog about RSI – VFM Direct)
Regards
Hi Sir,
RSI making lows but Nifty making high this is called negative divergence in Nifty which needs to be confoirmed with price also showing weakness. Which has not happened till now.
Rgds,
Bramesh
thank u sir ,,
for ur valuable analysis
Hi Karthik,
Thanks a lot !!
Rgds,
Bramesh
wait wait for down trend.i agreed
Dear bramesh
can you plese tell us which software is good for Intraday trader. free or paid.. any sofware which u have Good experience? I really need one for my trading ( intraday)
thanx
mahesh
Hi Sir,
You can go for amibroker, Share Khan trade tiger
Rgds,
Bramesh
superb analysis as usual throwing the light on bull mkt or bear mkt and trend deciding levels.
Hi Sir,
Thanks a lot for your appreciation….
Rgds,
Bramesh