Tata Steel
Tata Steel is at a crucial juncture @574,Level which has given support to Tata Steel 4 times on daily chart as can be seen in below chart.
Stock is trading below its 5 EMA Low@583 which should be watched closely if Tata Steel again bounce back from 574 levels.
Indicators are showing oversold charts but Indicators can remain overbought and oversold for extended period of time.
Sell below 574 TGt 571,565.8 and 555.2
Buy above 583 TGt 588 and 594
Nifty
Nifty Hourly charts is at a crucial juncture.In May series for past few trading sessions nifty is trading in range of 5440-5600 which is a range which needs to be broken for breakdown or breakup.
As shown on Hourly charts 5471(Nifty Spot) is an important level to watch.
Breakdown will occur on a close below 5440 and than we will show some quick moves in Nifty 5407.
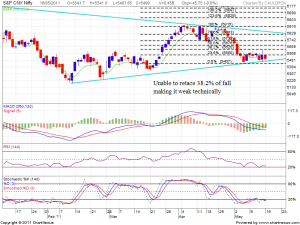
On Daily charts Nifty was unable to retrace 38.2% fall of 9 day fall which shown how much selling pressure we are getting on upper levels.
Sell Below 5487 Tgt 5471 5455,5423 and 5390
Buy above 5510 Tgt 5542 and 5563
All Mentioned all Spot Levels
Interested in Learning How to trade in Nifty/Stocks Profitably Intraday/Positional
If you are Loosing Money while trading it is because of 3 Reasons
- No Trading System -To Generate levels
- No Trading Plan -To Execute Trades
- Lack of Discipline
We can help you out in on the same bottlenecks and help you in trading profitably.
Call@09985711341
Email@bhandaribrahmesh@gmail.com


Thanks for the tata steel analysys.
Regards
Sachin P