Category Archives: Daily

Nifty Technical View

By | June 6, 2010 10:32 am

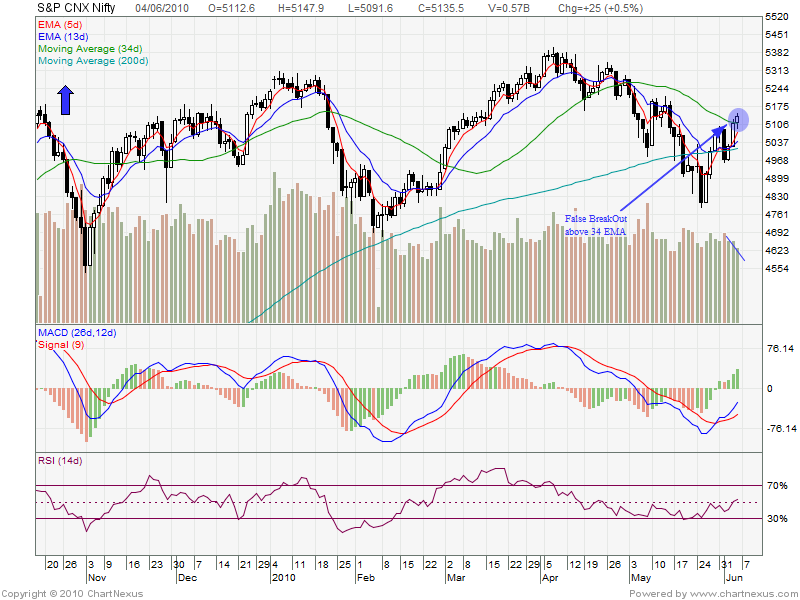
Nifty Futures Technical View Nifty Future technical  analysis for week starting 7 June is as follows As seen from the attached daily chart we did a break above 34 EMA and triggered SL for many longs also as discussed from last week Nifty Technical View 5110 was trend line resistance and above that we can… Read More »

Nifty Open Interest

By | June 2, 2010 3:15 pm

Open Interest Hi All, The traders who are trading in F&O Space must be familiar with this term,But many novice traders might not be having full knowledge and the benefits of Open Interest.I have compiled this article to have more clarity on OI and its use in trading. What is Open Interest? Open Interest is… Read More »

Nifty Weekly View

By | May 30, 2010 6:23 pm

Nifty rallied almost 6% from tuesday low of 4786 and being an expiry week rallied 4 trading session out of 5. For the coming week as we can see from the Daily Chart attached we have 2 resistance visible on chart. Middle Bollinger band where we are facing resistance which is placed around 5077 Trend… Read More »

Nifty Weekly Technical View

By | May 9, 2010 6:26 am

Nifty charts had formed continuous Hammer Patterns on the chart. Hammer candlesticks are formed when a security moves significantly lower but bulls retraced back from those lows to reach near the open. By day end buyers were able to push prices back to the upper range creating a short body candle with a long shadow.… Read More »

Nifty Weekly Technical

By | May 2, 2010 8:01 pm

Nifty Weekly Technical as we can see in daily chart Nifty is stuck between the Range of 5202 on downside and 5342 on Upside.So as of Now it did not Break this range Nifty Traders should use this range to Buy at Lower end of Range and Short at Higher End Of Range. Nifty Resistance:5342… Read More »

Short Term Stock Picks

By | April 25, 2010 11:54 am

Hyderabad Industries: Stock is in a trading range and Friday rose with volumes,Oscillators are showing Momentum play is in action Buy above 653  Tgt 663 674 and 682 SL 616 JP Associate: Stock closed above 200 DMA and broke above its trading range and volume action is fueeling its way towards higher indicator,As indicated in… Read More »

Face off SEBI V/S IRDA

By | April 12, 2010 2:48 pm

From Saturday night Royal battle is on between two of the biggest regulatory authorities of India – Securities and Exchange Board of India headed by CB Bhave and Insurance Regulatory and Development Authority (IRDA) headed by J Harinarayan over Unit Linked Insurance Plans (ULIPs) What Happened? SEBI shocked the industry by banning 14 of the… Read More »

Nifty Weekly Technical

By | April 11, 2010 6:56 am

Coming week will be a a crucial week for markets, as IIP-data for Feb.2010 will be announced on Monday 12th Apr, consensus estimate is 15.75% as compared to 16.7% previously. Lower IIP for feburary could prove to be a dampner. Following day on Tuesday 13th Apr, IT major INFOSYS will kick-start earning season for Indaian… Read More »

Real Time Charts

By | April 9, 2010 5:06 pm

Hi All, i have added Nifty and Stock Charts as a part of this Site.All the Real Time Charts of World and Advance Decline Pivot will come under the umbrella of this site,Blog will keep on running http://www.brameshtechanalysis.com/index.php/charts/—- All Charts at one Place Related Reading: Trader’s Blog Rgds, Bramesh