


Disclaimer
This analysis represents the highest-probability forecast derived from expert, multi-decade historical evaluation of astrological signatures and their documented correlation with market psychology and price action.
No Guarantee
This is not a guarantee of future market performance. Financial markets are influenced by numerous dynamic and unpredictable real-world factors. All trading and investment activities carry significant risk, including the potential loss of principal.
Educational Purpose Only
This content is strictly for informational and educational purposes and should not be construed as financial advice or a recommendation to buy, sell, or trade any financial instrument.
Consult a Professional
We strongly advise you to consult a qualified financial advisor before making any investment decisions. Any actions you take based on this analysis are solely your responsibility. We assume no liability for any financial profits or losses that may occur.
Theme for Nifty: The Gann Multiple Ignition & The Eight-Week Shakeout
- Act I (Start of Week): Nifty opens Monday under the crushing weight of eight consecutive weekly red candles at CMP 23140. The market immediately collides with the Full Moon and Mars ingressing into Leo, alongside Sun Trine Uranus and Mercury at Maximum Distance. This creates an immediate downside liquidity flush at the open. The primary downside line in the sand is Weekly S1 at 22944. A rapid sweep into the 23000–22944 pocket triggers algorithmic absorption, as Sun Trine Uranus injects sudden, impulsive buying. The initial 15-minute range will establish the low of the week.
For a Detailed Day by Day Forecast with Neural Analysis Please watch the below video
Nifty Harmonic Pattern
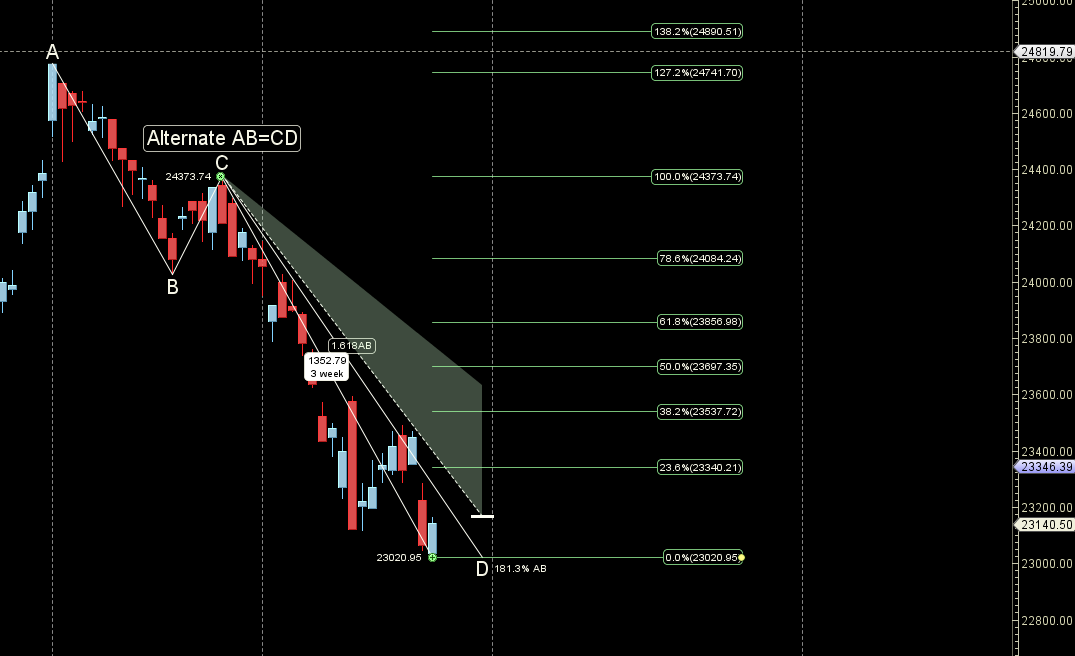
Price has completed its ABCD pattern holding 22950-23000 can see upmove towards 23340/23537
Nifty Gann Angles
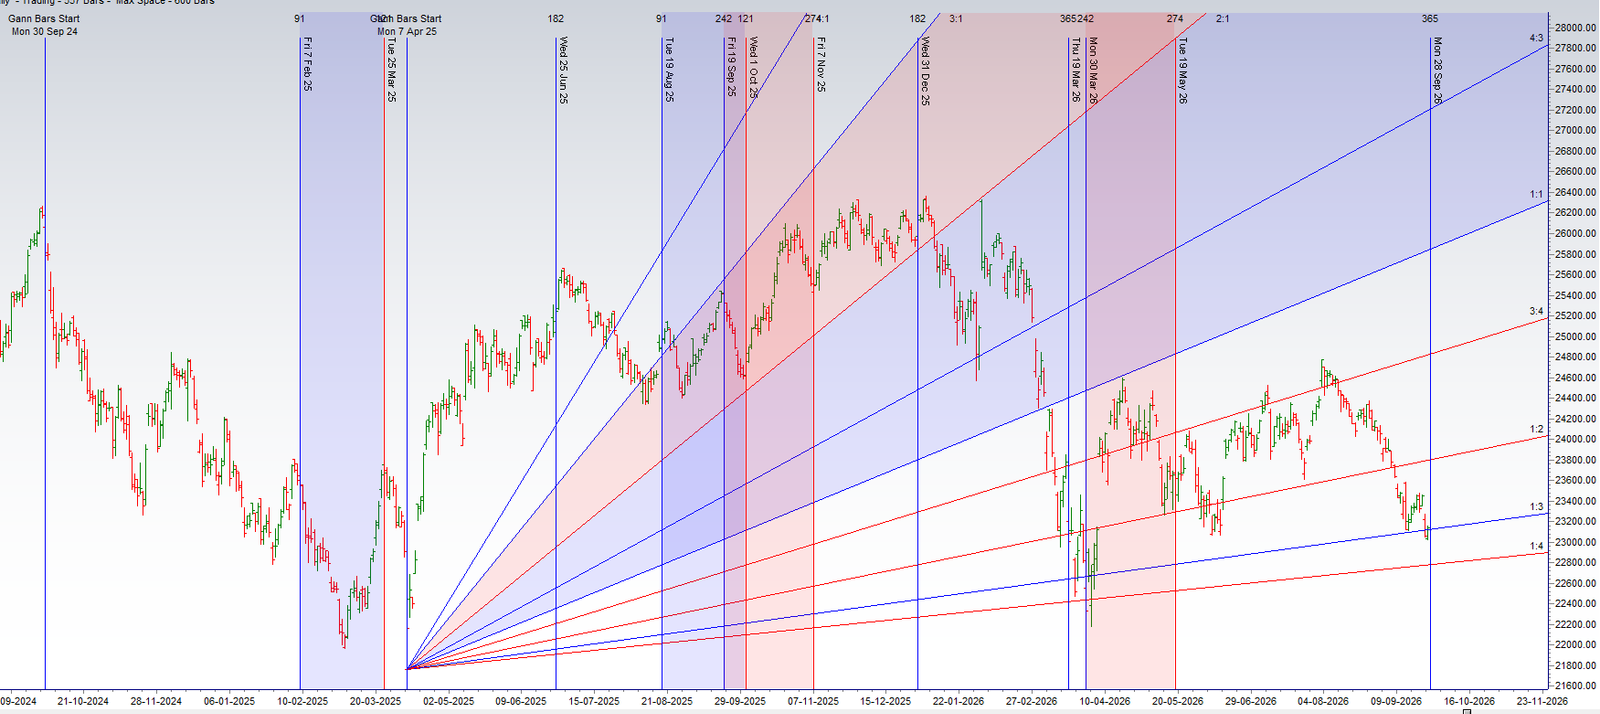
Price has taken support at 1×3 gann angle support and near 28 Sep Time cycle.
Nifty Supply and Demand
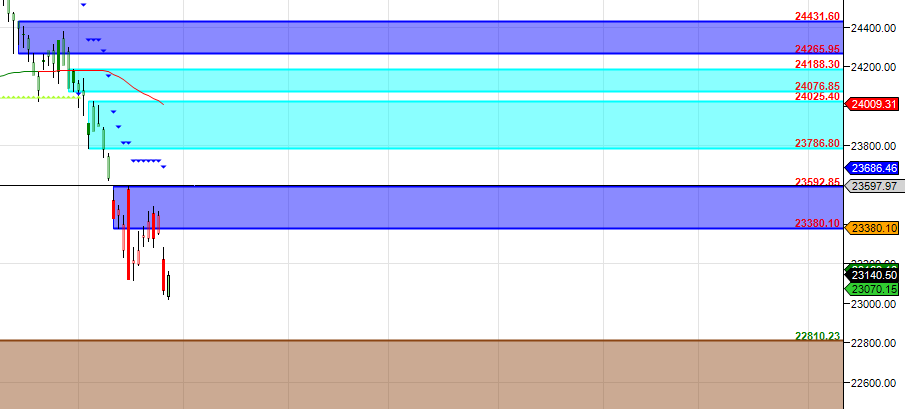
Self Explanatory Chart
Nifty Time Analysis Pressure Dates
Key Pivot Dates: Watch 28 Sep/01 Oct
Nifty Weekly Chart
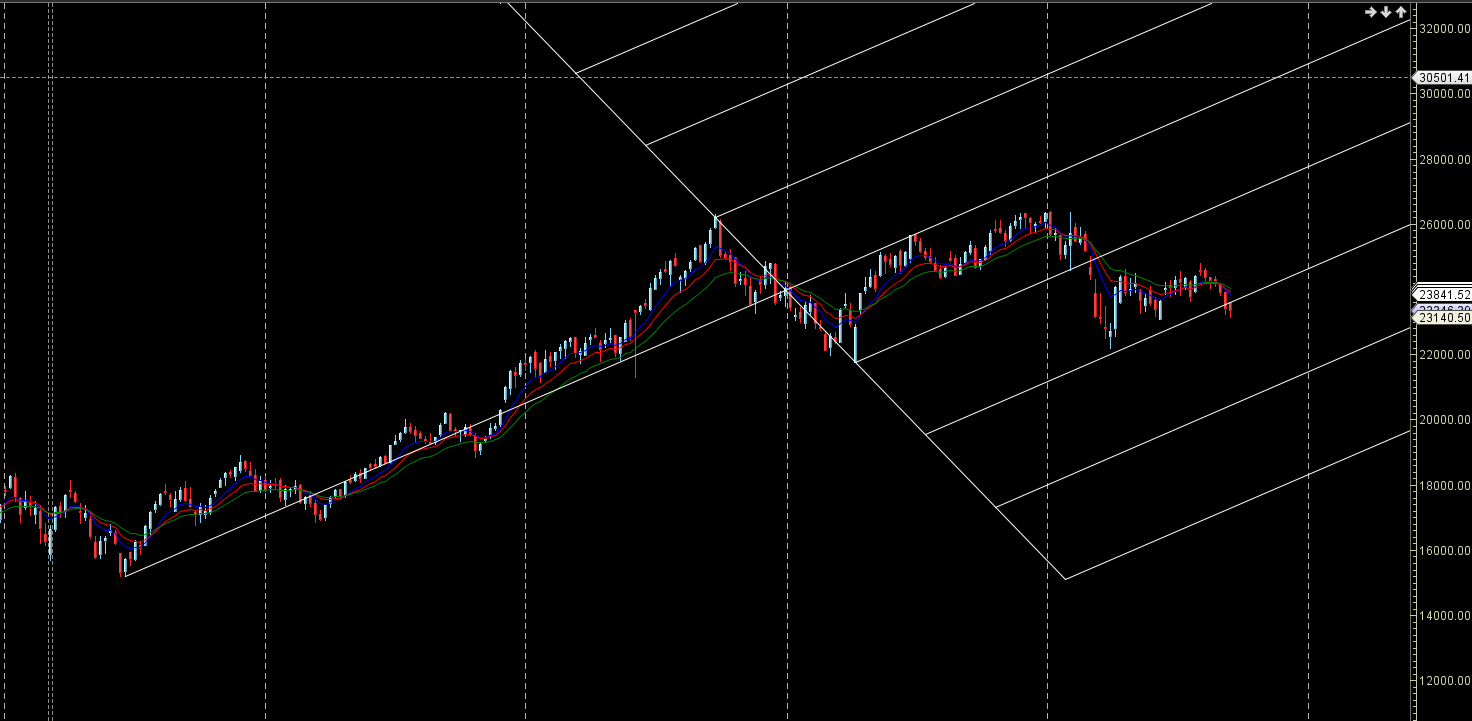
Nifty has seen 8 weeks of fall near AF support zone.
Nifty Monthly
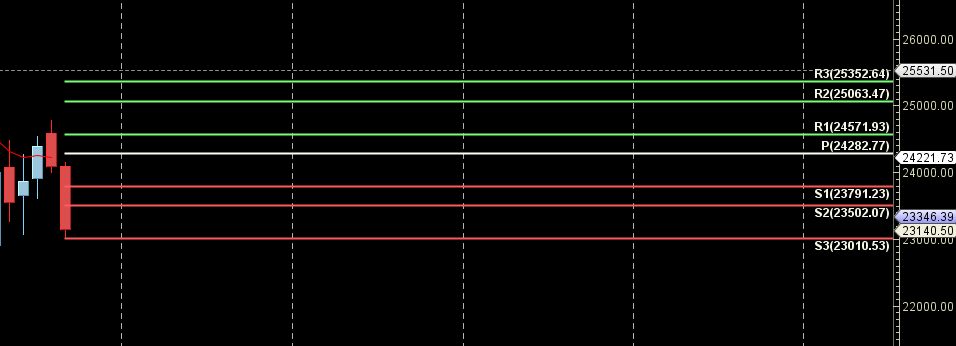
23502 is Monthly resistance zone 23010 is Monthly Support zone.
Nifty Weekly Levels
Nifty Trend Deciding Level: 23182
Nifty Resistance: 23259 23335 23412 23489
Nifty Support: 23105 23029 22952 22876
Levels mentioned are Nifty Spot
As always I wish you maximum health and trading success
Learn More:
W.D. Gann Trading Strategies – Learn how to decode markets using price, time, and geometry.
Trading Using Financial Astrology – Discover how planetary motion impacts market behavior and how to trade it effectively.
Ready to Trade Like a Time-Master?
Join our one-on-one mentorship to master astro-timing, Gann analysis, and institutional-grade setups.
Call: 09985711341
Email: bhandaribrahmesh@gmail.com
Guruji, your weekly view is contradicting with your annual view for Nifty. In annual view, you have told Nifty will make high of the year on around Sep 24th but now story different. Please clarify
thats correct with 8 weeks alrady down you cannot a yearly high so we need to adapt and change based on currect market conditions