


A storm of regulatory headwinds, event-driven volatility, and cyclical pressure triggered a severe 1,110-point intraday drop in Bank Nifty, culminating in a 1,069-point decline in September Futures to settle at 55,438.
Foreign Institutional Investors (FIIs) expanded their short exposure aggressively, shorting 5,014 contracts valued at ₹846.42 crore, driving an open interest (OI) expansion of 4,078 contracts.
With the market now heading into a critical weekly close—marking a potential fourth consecutive week of net losses—the technical, derivative, and astro-cyclical indicators outline a clear battlefield.
1. The Catalysts Behind the 1,110-Point Plunge
The sharp breakdown in Bank Nifty was driven by three compounding forces:
-
The IRDAI Draft Paper Fallout: The insurance regulator’s newly released draft paper rattled market sentiment across financial counters. Proposed adjustments to policyholder surrender values and intermediary commission disclosures directly hit insurance balance sheets. Because India’s premier private and public lenders (HDFC Bank, ICICI Bank, SBI, Axis Bank) hold significant promoter stakes in major life and general insurance subsidiaries, institutional de-risking in insurance stocks triggered broad-based contagion across the banking index.
-
NSE Listing Day Sentiment: Event-driven reallocations and high volatility surrounding the NSE listing session created liquidity imbalances, amplifying institutional unwinding across frontline banking heavyweights.
-
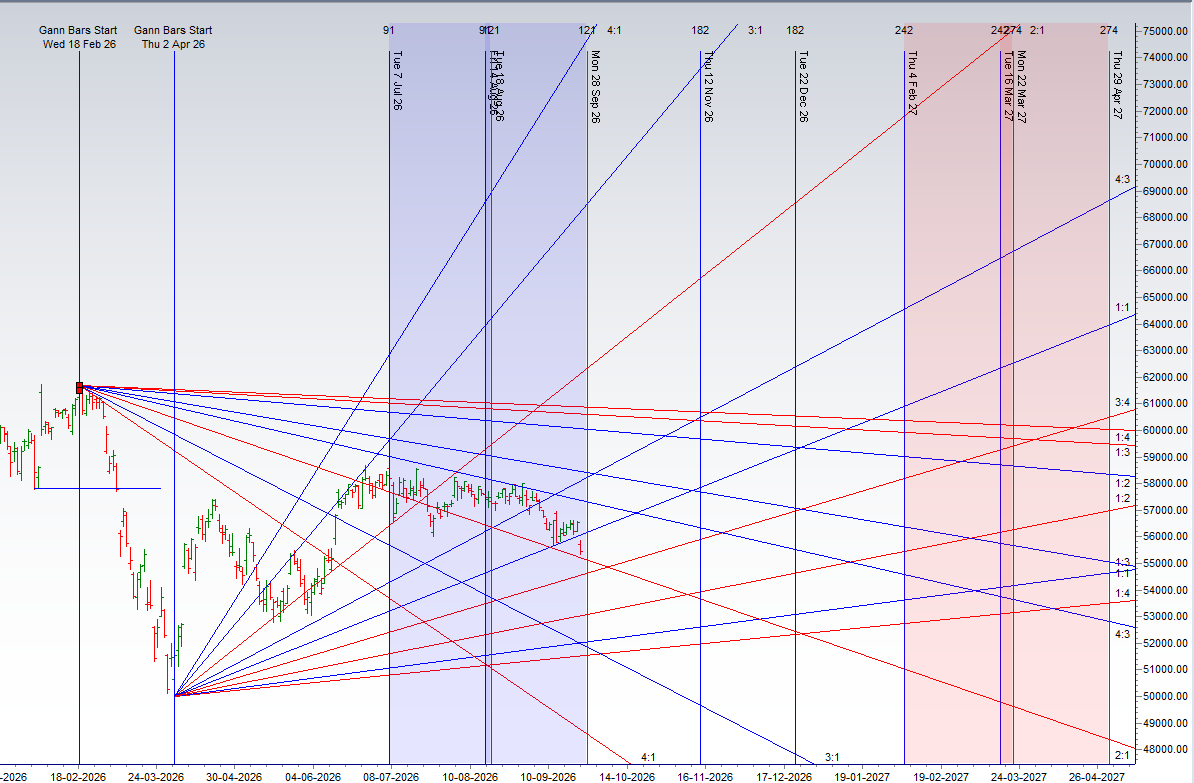
Astro-Cyclical Impact (Rahu Retrograde): In financial astrology and cyclical market timing, Rahu’s retrograde motion is recognized for inciting sudden, non-linear market dislocations, deceptive spikes, and severe institutional liquidations. The alignment triggered a wave of distribution that broke critical Gann levels without meaningful intraday relief rallies.
2. Institutional & Derivative Data
-
FII Activity: Aggressive short buildup with 5,014 contracts shorted (₹846.42 crore) and net OI increasing by 4,078 contracts.
-
Breadth & Participation: The Advance-Decline ratio stood at 00:14, showing unanimous downside participation across all 14 major banking constituents.
-
Futures OI & Cost of Carry: September Futures OI stands at 17.7 lakh contracts following a liquidation of 0.48 lakh contracts. Despite dominant institutional selling, an increase in the Cost of Carry signals pockets of intraday short-covering.
-
Sentiment Metrics:
-
Put-Call Ratio (PCR): Dropped to 0.74, signaling oversold territory dominated by aggressive call writing.
-
Max Pain: 56,500.
-
Key Resistance (Highest Call OI): 55,000 strike.
-
Key Support (Highest Put OI): 56,000 strike.
-
Rollover Benchmark: Rollover cost sits at 57,901, keeping macro trend filters in deep negative territory.
-
3. Gann Octave Breakdown & Weekly Close Dynamics
Price action breached and closed decisively below the major Gann octave point of 55,744, shifting the broader trend structure firmly into bear control:
-
The 4th Week of Decline: As the market heads into today’s weekly candle close, Bank Nifty is on track to record its fourth straight weekly loss.
-
Downside Path to 55,004: As long as price remains suppressed below the 55,744 octave mark, the index remains vulnerable to further structural declines targeting the next major Gann support at 55,004.
-
The Bullish Reclaim Condition: To neutralize this breakdown, buyers must force a daily/weekly close back above 55,744. Only a sustained recovery above this level will pave the way for an institutional short-covering rally toward 56,485.
4. Key Institutional Levels & Intraday Trading Plan
-
Positional Trend Change Level: 56,415 (Positional bias remains short while trading below this level to mirror institutional flow).
-
Intraday Trend Change Level: 55,791.
Intraday Pivot Zones
-
Bullish Trigger (Upside): A sustained move above 55,800 indicates immediate intraday buying momentum.
-
Upside Targets: 55,950 | 56,100 | 56,225
-
-
Bearish Trigger (Downside): Renewed selling pressure resumes if the index drops below 55,555.
-
Downside Targets: 55,445 | 55,300 | 55,108
-
Intraday Time Reversal Windows
Monitor order flow and price action closely around these key cyclical inflection points for potential trend pauses or sharp reversals:
-
10:14 IST
-
12:29 IST
-
01:37 IST
-
02:36 IST
Disclaimer: This analysis is published purely for educational and observational purposes based on derivative data, technical structures, and cyclical frameworks. Trading index futures and options carries substantial risk; always maintain strict stop-losses and disciplined position sizing.