


Disclaimer
This analysis represents the highest-probability forecast derived from expert, multi-decade historical evaluation of astrological signatures and their documented correlation with market psychology and price action.
No Guarantee
This is not a guarantee of future market performance. Financial markets are influenced by numerous dynamic and unpredictable real-world factors. All trading and investment activities carry significant risk, including the potential loss of principal.
Educational Purpose Only
This content is strictly for informational and educational purposes and should not be construed as financial advice or a recommendation to buy, sell, or trade any financial instrument.
Consult a Professional
We strongly advise you to consult a qualified financial advisor before making any investment decisions. Any actions you take based on this analysis are solely your responsibility. We assume no liability for any financial profits or losses that may occur.
Theme: Algorithm Exhaustion and Dislocation Mechanics
- Act I (Start of Week) Following Sun and Mercury’s sharp ingress into mechanical Virgo on Monday, the heaviest components of the index fall victim to massive internal tier rotation. Algorithmic blocks anchor heavy upper limits, crushing largecap buoyancy. On the Tuesday Expiry crossover, with North Node opposing Mercury, these algorithmic limits serve to relentlessly distribute to retail trapped on false upside flag patterns. Institutional footprints clearly mandate trading immediate reversals at initial upper volatility bands, utilizing wide ATR-stop thresholds strictly.
For a Detailed Day by Day Forecast with Neural Analysis Please watch the below video
SENSEX Harmonic Pattern
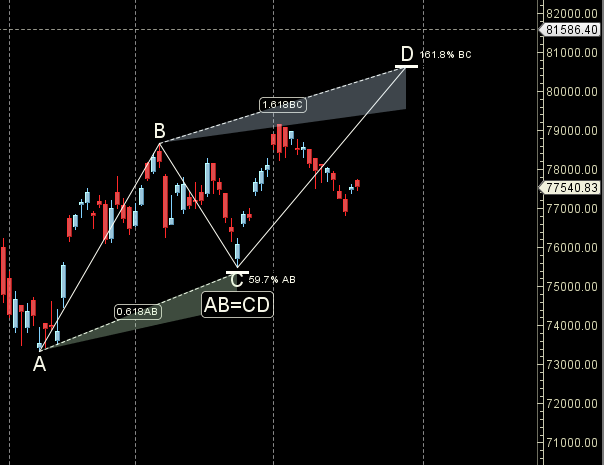
Till 77000 is held we can see upmove till 78000/78500
SENSEX Gann Angles
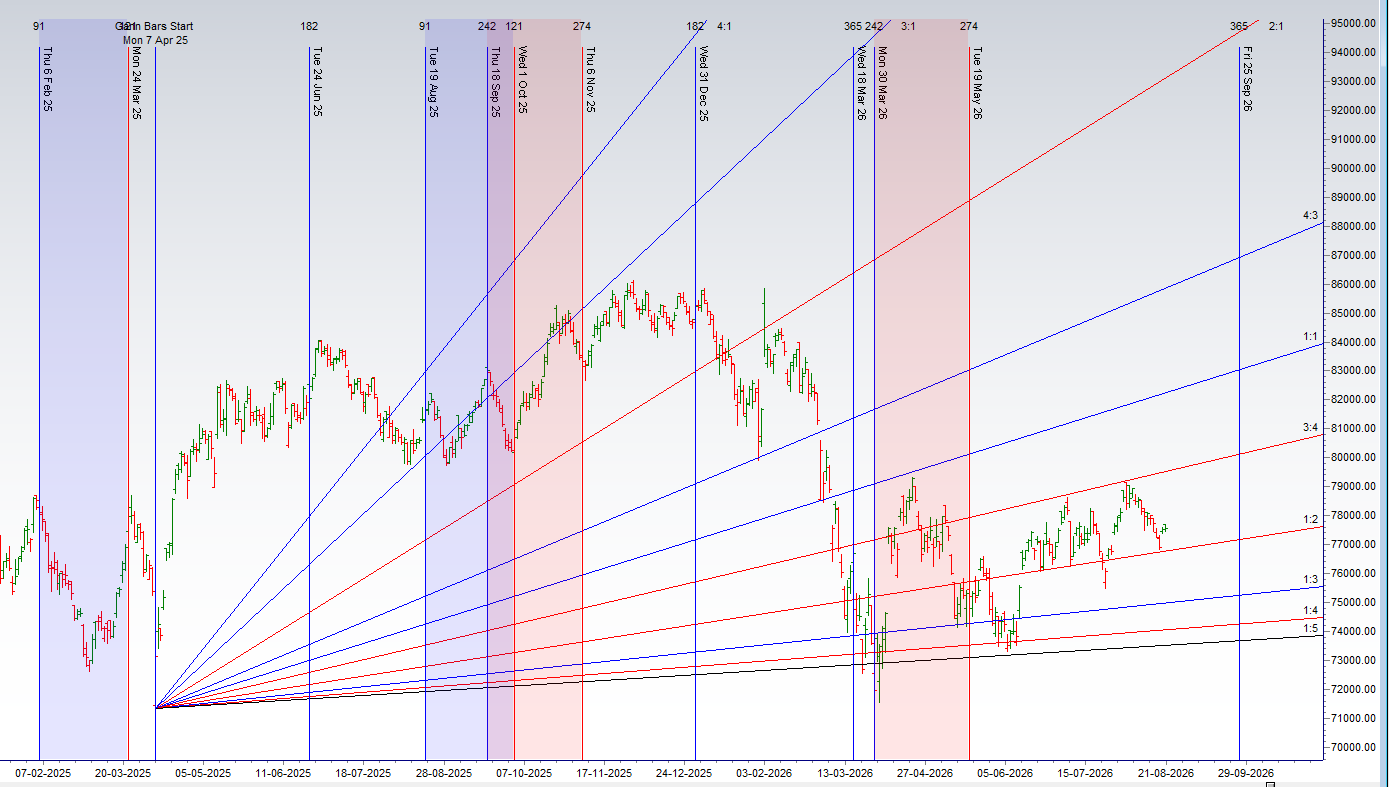
Sensex is heading back to its 3×4 gann angle zone
SENSEX Supply and Demand
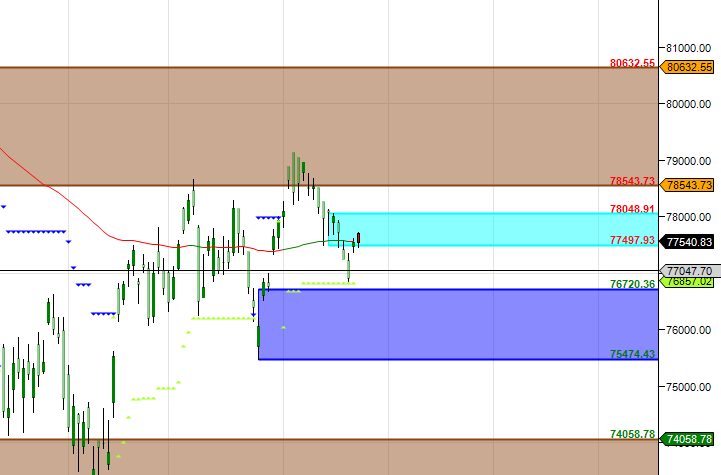
Self Explanatory Chart
SENSEX Time Analysis Pressure Dates
Key Pivot Dates: Watch 24/28August
SENSEX Weekly Chart
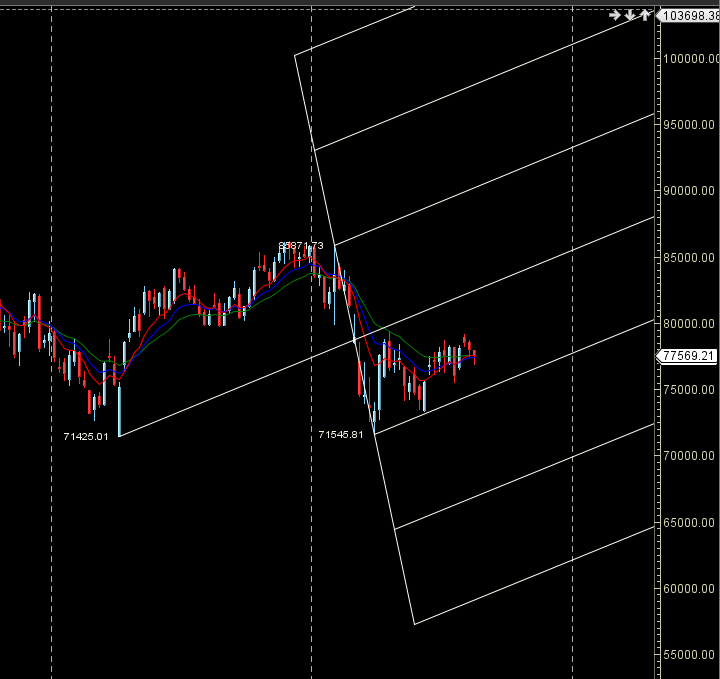
Sensex formed weekly lower low with Hammer
SENSEX Monthly Charts
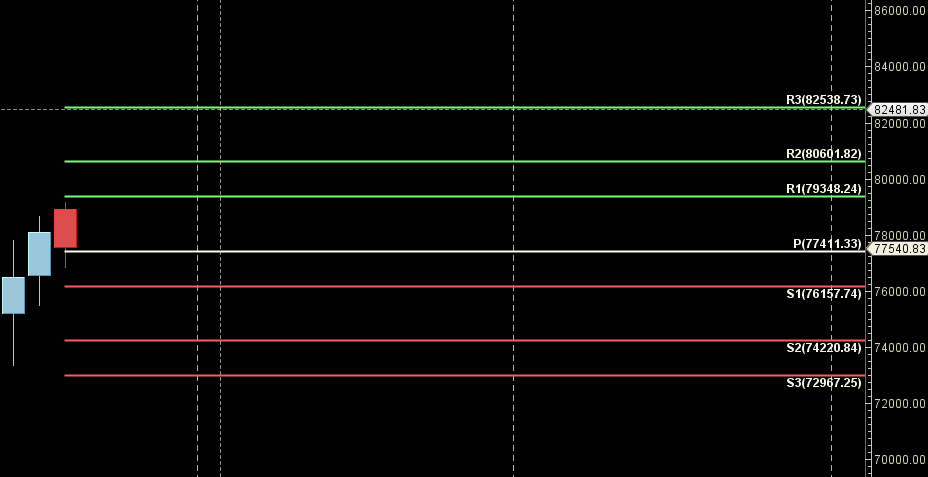
77000 is Monthly resistance zone 78500 is Support zone.
SENSEX Weekly Levels
SENSEX Trend Deciding Level: 77654
SENSEX Resistance: 77931 78208 78485 78763
SENSEX Support: 77377 77100 76822 76666
Levels mentioned are SENSEX Spot
Learn More:
W.D. Gann Trading Strategies – Learn how to decode markets using price, time, and geometry.
Trading Using Financial Astrology – Discover how planetary motion impacts market behavior and how to trade it effectively.
Ready to Trade Like a Time-Master?
Join our one-on-one mentorship to master astro-timing, Gann analysis, and institutional-grade setups.
Call: 09985711341
Email: bhandaribrahmesh@gmail.com