


Disclaimer
This analysis represents the highest-probability forecast derived from expert, multi-decade historical evaluation of astrological signatures and their documented correlation with market psychology and price action.
No Guarantee
This is not a guarantee of future market performance. Financial markets are influenced by numerous dynamic and unpredictable real-world factors. All trading and investment activities carry significant risk, including the potential loss of principal.
Educational Purpose Only
This content is strictly for informational and educational purposes and should not be construed as financial advice or a recommendation to buy, sell, or trade any financial instrument.
Consult a Professional
We strongly advise you to consult a qualified financial advisor before making any investment decisions. Any actions you take based on this analysis are solely your responsibility. We assume no liability for any financial profits or losses that may occur.
Theme: The Saturnine Retrograde
- Act I (Start of Week):The Sensex is set for a sharp, institutionally driven markdown at Monday’s open. The retrograde station of Saturn in Aries, combined with Bayer Rule 20and the Lunar Eclipse 144-Degree Date, will force large-cap portfolio managers to aggressively de-risk.However, the 5% crude oil decline and positive US-Iran peace traction will provide a solid fundamental cushion. The selling pressure will exhaust itself on Monday afternoon as value-buyers begin accumulating heavyweight blue chips at deep discounts. Tuesday’s Monthly Expiry will trigger a powerful short-covering rally, with the Sensex gapping up and trending strongly as short sellers are forced to cover their positions.
For a Detailed Day by Day Forecast with Neural Analysis Please watch the below video
SENSEX Harmonic Pattern
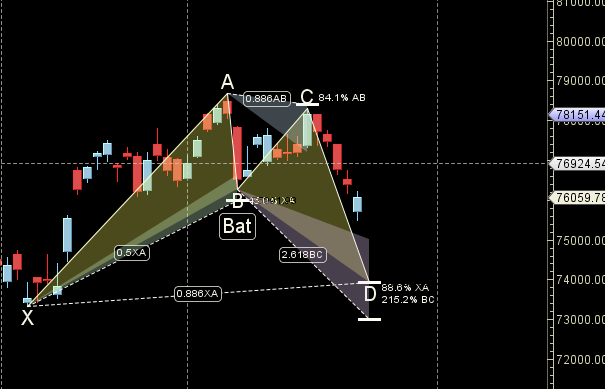
Till 75800 is held we can see upmove till 76500/77000
SENSEX Gann Angles
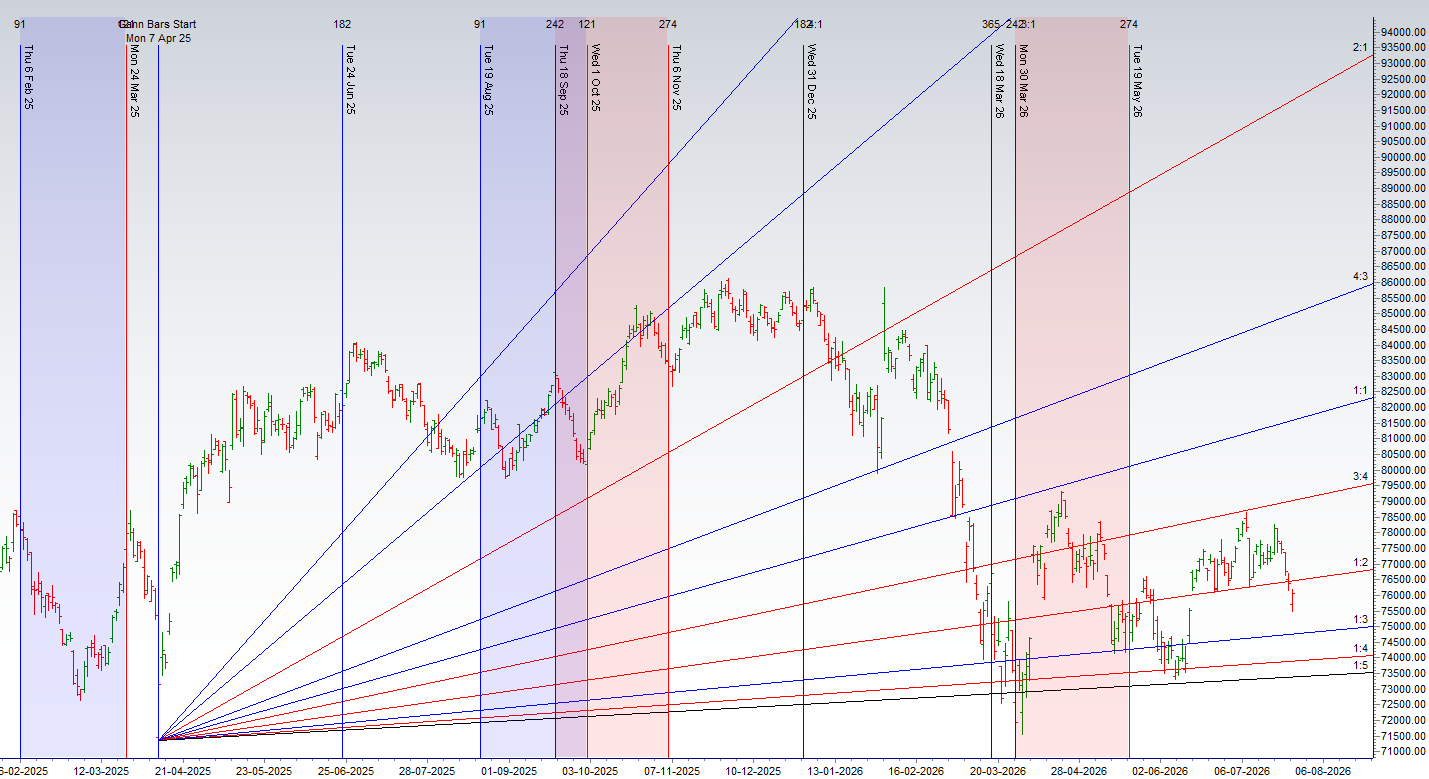
Sensex is heading back to its 1×2 gann angle zone
SENSEX Supply and Demand
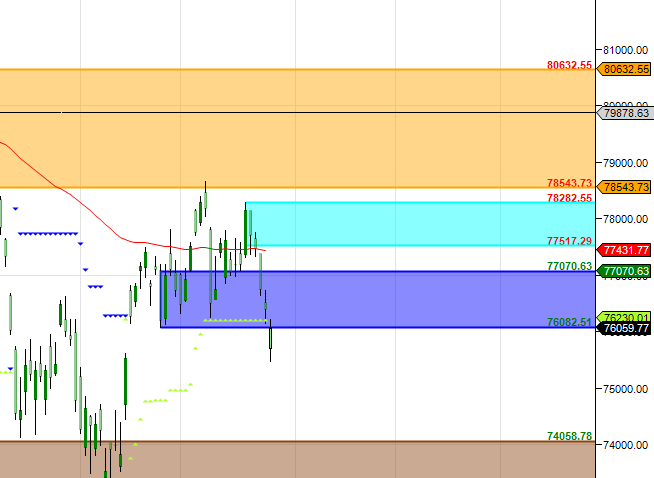
Self Explanatory Chart
SENSEX Time Analysis Pressure Dates
Key Pivot Dates: Watch 27 July
SENSEX Weekly Chart
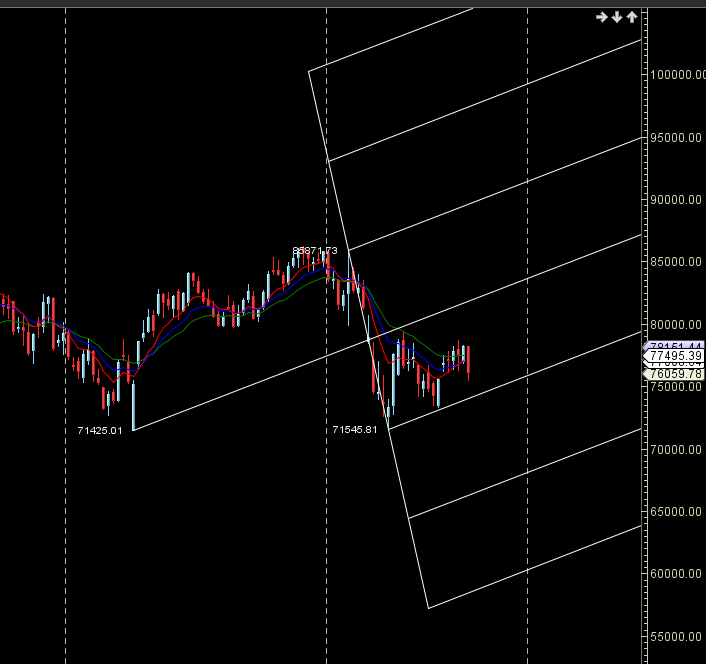
Sensex formed weekly lower low
SENSEX Monthly Charts
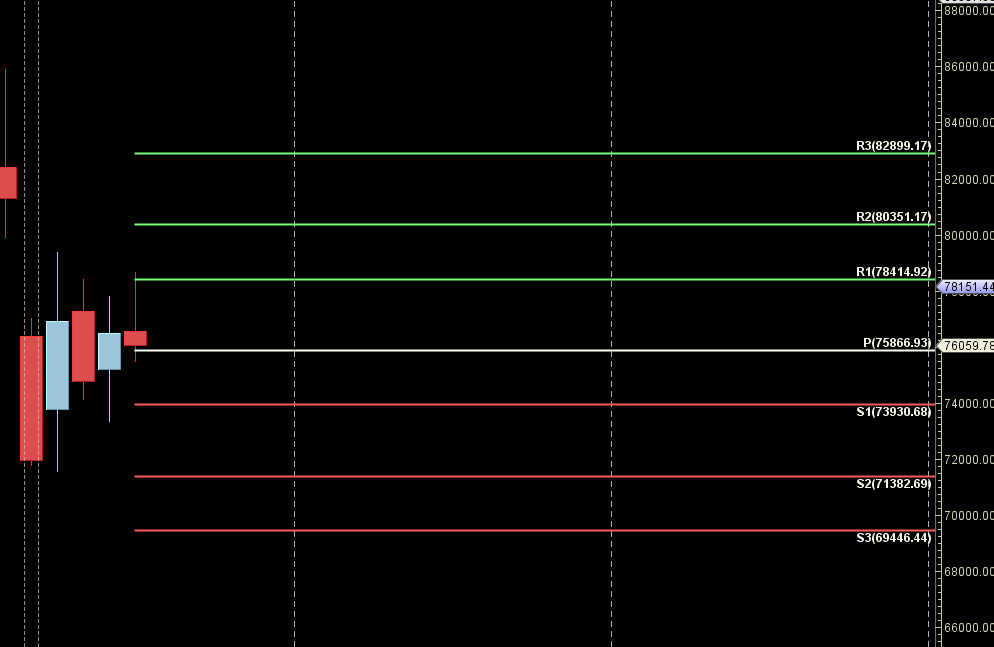
78414 is Monthly resistance zone 75764 is Support zone.
SENSEX Weekly Levels
SENSEX Trend Deciding Level: 76023
SENSEX Resistance: 76298 76573 76848 77122 77397 77680
SENSEX Support: 75479 75474 75214 74943 84672 74402
Levels mentioned are SENSEX Spot
Learn More:
W.D. Gann Trading Strategies – Learn how to decode markets using price, time, and geometry.
Trading Using Financial Astrology – Discover how planetary motion impacts market behavior and how to trade it effectively.
Ready to Trade Like a Time-Master?
Join our one-on-one mentorship to master astro-timing, Gann analysis, and institutional-grade setups.
Call: 09985711341
Email: bhandaribrahmesh@gmail.com