


Disclaimer
This analysis represents the highest-probability forecast derived from expert, multi-decade historical evaluation of astrological signatures and their documented correlation with market psychology and price action.
No Guarantee
This is not a guarantee of future market performance. Financial markets are influenced by numerous dynamic and unpredictable real-world factors. All trading and investment activities carry significant risk, including the potential loss of principal.
Educational Purpose Only
This content is strictly for informational and educational purposes and should not be construed as financial advice or a recommendation to buy, sell, or trade any financial instrument.
Consult a Professional
We strongly advise you to consult a qualified financial advisor before making any investment decisions. Any actions you take based on this analysis are solely your responsibility. We assume no liability for any financial profits or losses that may occur.
Theme: The Blue-Chip Reality Check
- Act I (Start of Week – Mon/Tue): The Institutional Stress Test.The Sensex faces a methodical, institutionally driven test of its recent gains. Monday’s Sun-Saturnsquare demands fundamental justification as earnings season begins. Foreign and domestic funds will use this astrological cover to execute a controlled rotation, leading to sustained selling pressure in index heavyweights. The primary objective is a controlled pullback to major structural support. The Neptune Station on Tuesday will create a severe “valuation fog.” The market will question the sustainability of the crude-driven rally. Expect choppy, frustrating, range-bound trading near the lows as institutions mask their accumulation or distribution.
For a Detailed Day by Day Forecast with Neural Analysis Please watch the below video
SENSEX Harmonic Pattern
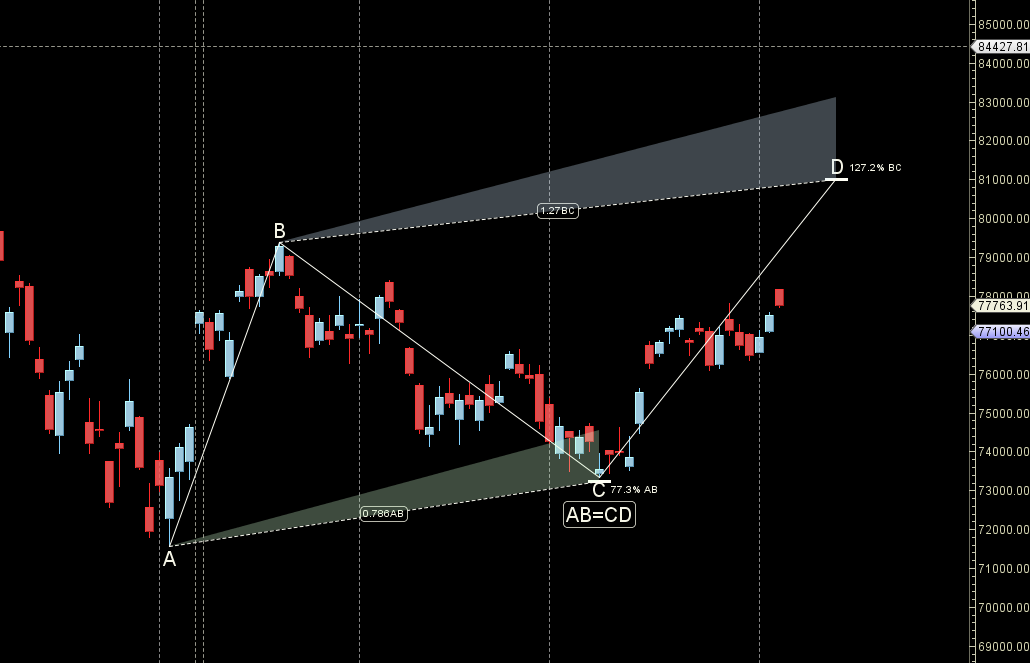
Till 77000 is held we can see upmove till 78500/79000
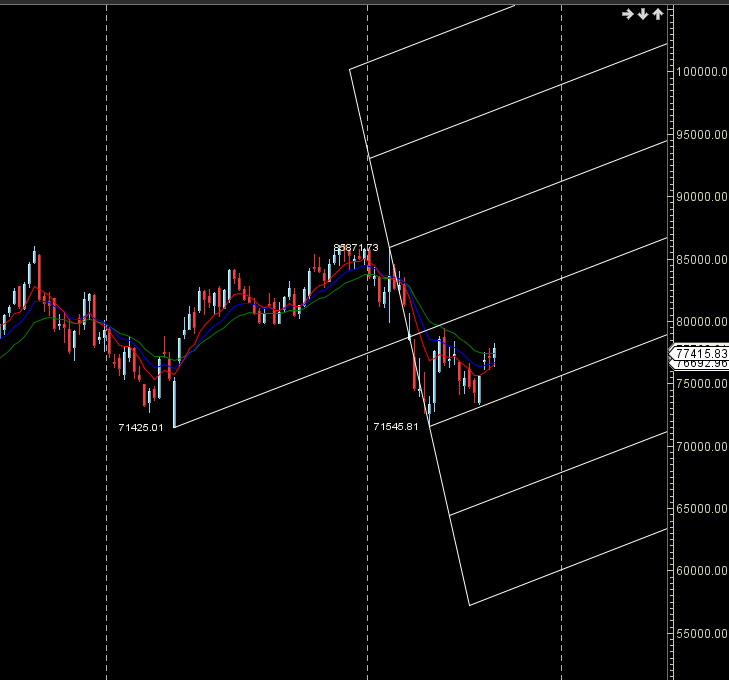
SENSEX Gann Angles
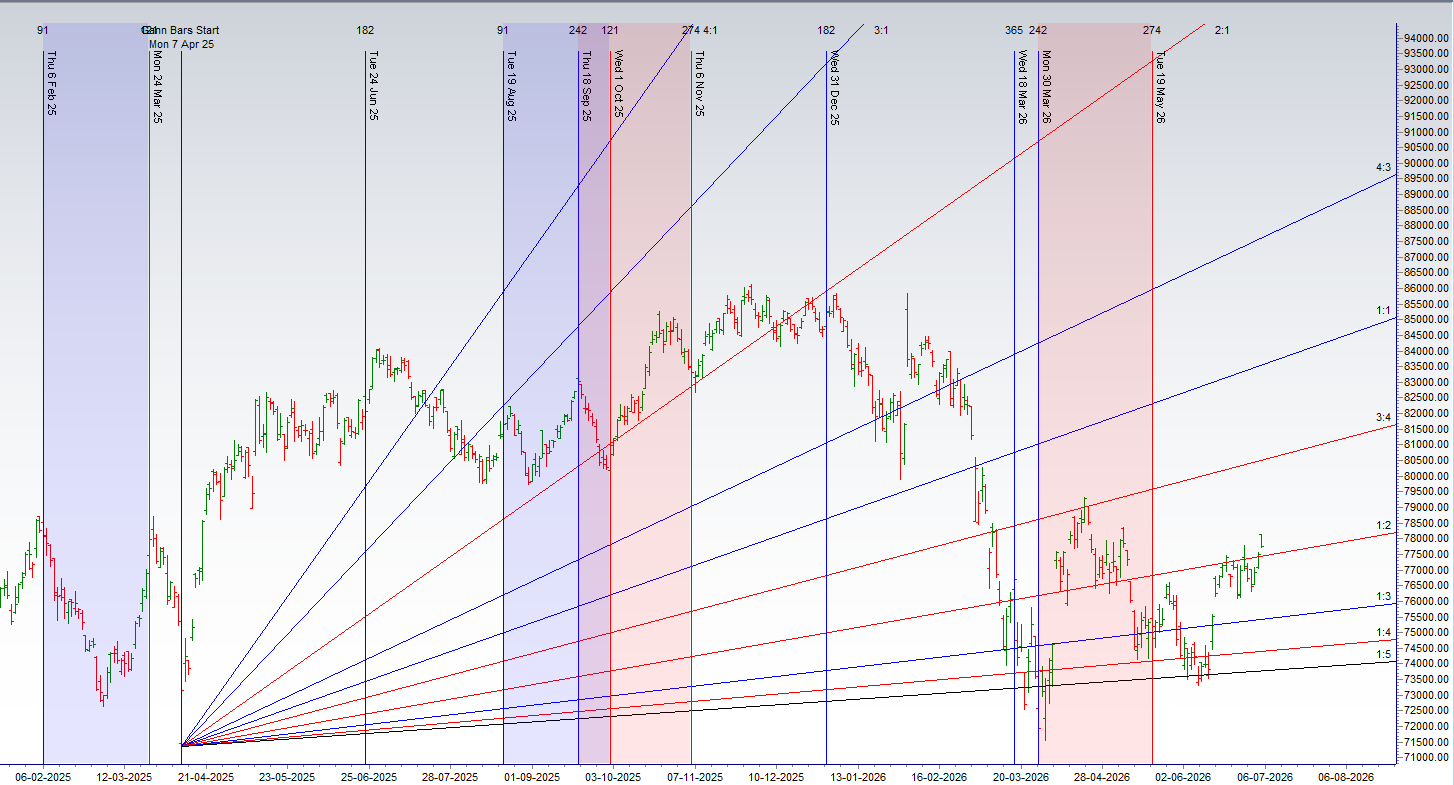
Sensex has broken out of its 1×2 gann angle zone
SENSEX Supply and Demand
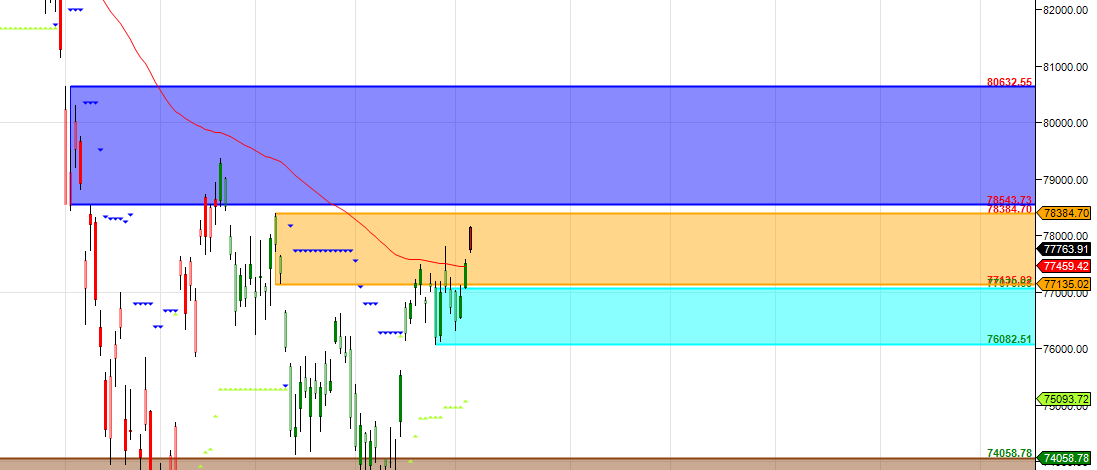
Self Explanatory Chart
SENSEX Time Analysis Pressure Dates
Key Pivot Dates: Watch 07/10 July
SENSEX Weekly Chart
Sensex has broken out of weekly MA
SENSEX Monthly Charts
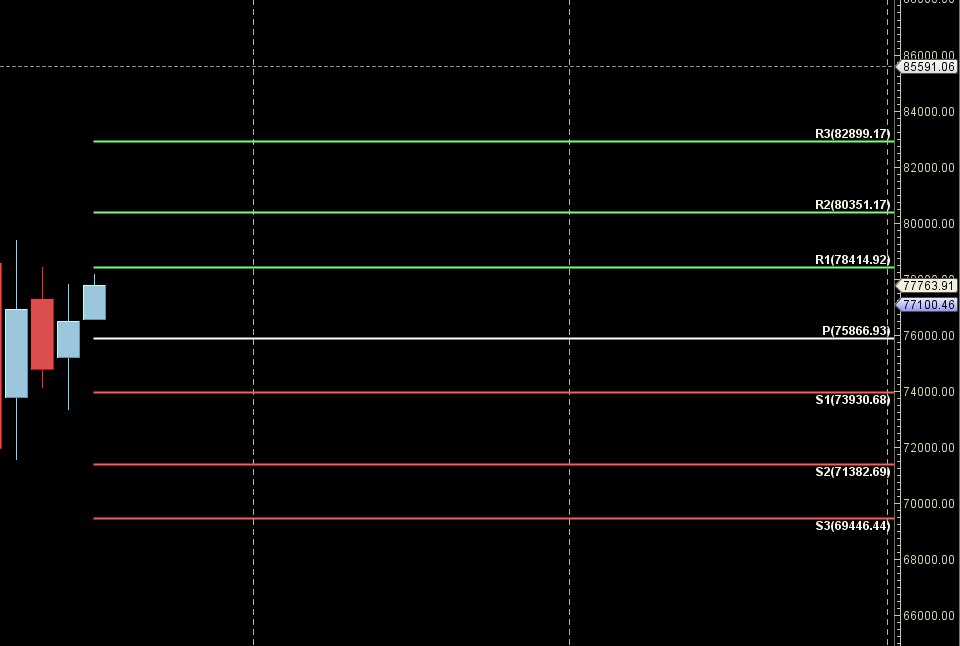
78414 is Monthly resistance zone 75866 is Support zone.
SENSEX Weekly Levels
SENSEX Trend Deciding Level: 77710
SENSEX Resistance: 77987 78263 78539 78888 80008
SENSEX Support: 77434 77158 76882 76605 76329
Levels mentioned are SENSEX Spot
Learn More:
W.D. Gann Trading Strategies – Learn how to decode markets using price, time, and geometry.
Trading Using Financial Astrology – Discover how planetary motion impacts market behavior and how to trade it effectively.
Ready to Trade Like a Time-Master?
Join our one-on-one mentorship to master astro-timing, Gann analysis, and institutional-grade setups.
Call: 09985711341
Email: bhandaribrahmesh@gmail.com