


As we assess the Bank Nifty landscape after the 03 July 2026 trading session, indecision and institutional hedging remain the underlying themes. Despite positive to neutral Q1 business updates coming from major banks, the Bank Nifty index slipped by 129 points following a volatile daily range of 441 points. With IT stocks briefly stealing the limelight, money is rotating out of the banking space.
So, what should your strategy be heading into the next sessions? Let’s dive deep into the FII data, options chain, and technical setup to find out.
1. The Institutional Footprint: FIIs Remain Bearish
Following the smart money is the first rule of survival, and right now, the smart money is playing defense.
-
FII Activity: Foreign Institutional Investors maintained a bearish posture by shorting 2,145 contracts worth ₹374.98 crores in Bank Nifty Futures. This resulted in a slight net Open Interest (OI) drop of 175 contracts in their net position.
-
Derivative Data: Bank Nifty futures saw an OI volume of 22.2 Lakh, with a fresh addition of 0.30 Lakh contracts. Crucially, this was accompanied by an increase in the Cost of Carry, heavily suggesting a build-up of fresh SHORT positions.
-
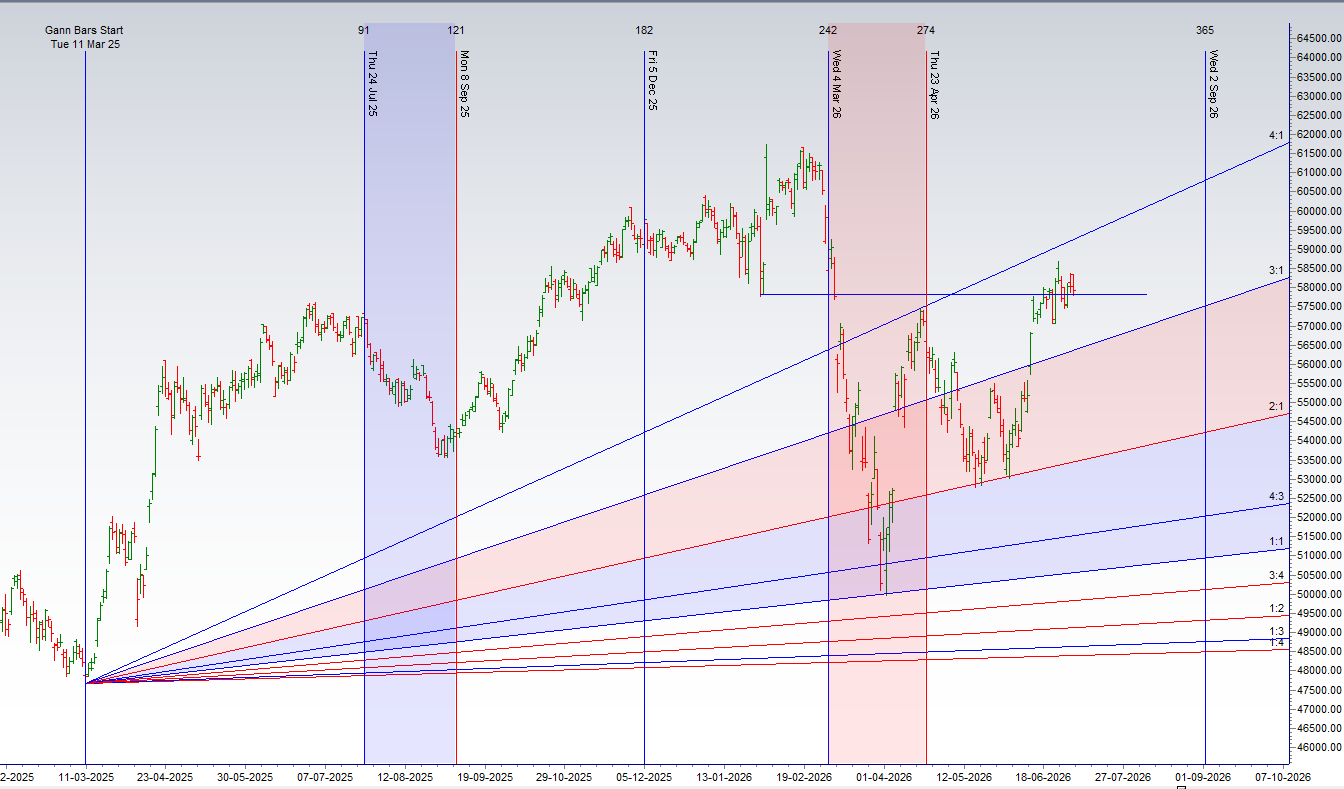
Rollover Headwinds: The index closed at 57,973.80, securely below the critical Rollover Cost level of 58,495. This reinforces a “sell-on-rise” institutional bias for the time being.
2. Technical Analysis: The Calm Before the Storm
Bank Nifty’s weekly charts are screaming consolidation. The index has formed a DOJI candle alongside an Inside Bar pattern. This double confirmation signals high market indecision. The advance/decline ratio is completely balanced at 07:07, indicating absolute tug-of-war between buyers and sellers.
-
Macro Cues to Watch: Expect the index to remain largely bound in a wide trading range between 57,100 – 58,500 until July 09th. Why July 9th? That is when the highly anticipated TCS Q1 results arrive, coinciding with a key astrological transit (Venus sign change). These two events will likely be the catalyst for the next directional move in both IT and Financials.
3. Options Chain Outlook (The Expiry Setup)
Options data reflects the same story of range-bound expectation:
-
PCR (Put-Call Ratio): 0.84 – A reading leaning mildly bearish but well within neutral, choppy territory.
-
Max Pain: 58,100 (This level acts as a magnet; expiry close near here ensures minimum loss to option sellers).
-
Key Call Resistance: 59,000
-
Key Put Support: 57,000
Actionable Trade Plan for Bank Nifty Spot
Given the trapped nature of the index, disciplined execution around pivot zones is crucial. Keep a close watch on these critical triggers for your next trade:
A. Intraday Spot Trading Setup
The market is currently inside a tight bracket. Avoid middle-of-the-range chopping and wait for the extremes.
-
🟢 The Bullish Trigger (Upside Strength): Go LONG only if the index sustains above 58,056. Breaking this zone could trap early shorters, opening the door for targets at: 58,177 | 58,345 | 58,555.
-
🔴 The Bearish Trigger (Downside Weakness): Short the index if it breaks and holds below 57,900. Selling pressure will intensify, pulling the index toward support zones at: 57,767 | 57,599 | 57,478.
B. Golden Pivot Levels (Trend Changers)
If you are looking to align with institutional risk-reward structures, mark these two futures levels on your terminal immediately:
-
Intraday Trend Change Level: 58,305. Sustaining above this flips intraday bias to long.
-
Positional Trend Change Level: 58,277. Positional traders should manage long/short swing plays relative to this level. Being on the right side of this line keeps you aligned with FII mechanics.
C. Time-Based Reversal Zones
For Intraday Time and Astro/Gann traders, pay extreme attention to price action at these precise time slots. Often, false breakouts peak and trend reversals trigger precisely on the minute at:
🕒 09:15 AM | 11:14 AM | 12:41 PM | 01:24 PM
Closing Thoughts:
Right now, the bears hold a slight upper hand strictly based on FII positioning and cost-of-carry metrics, but the Doji structure implies buyers haven’t totally given up. Be nimble. Use strict stop losses below support / above resistance, as inside bar ranges can be unforgiving if chopped, but highly profitable upon an aggressive breakout.
Safe trading !!