


Disclaimer : This analysis represents the highest-probability forecast derived from expert, multi-decade historical evaluation of astrological signatures and their documented correlation with market psychology and price action.
No Guarantee: This is not a guarantee of future market performance. Financial markets are influenced by numerous dynamic and unpredictable real-world factors. All trading and investment activities carry significant risk, including the potential loss of principal.
Educational Purpose Only :This content is strictly for informational and educational purposes and should not be construed as financial advice or a recommendation to buy, sell, or trade any financial instrument.
Consult a Professional :We strongly advise you to consult a qualified financial advisor before making any investment decisions. Any actions you take based on this analysis are solely your responsibility. We assume no liability for any financial profits or losses that may occur.
Theme: The Martian Fire and the Pluto Re-Pricing
-
Monday, April 6: The Jupiter Friction.
Crude Oil is poised to open with a “False High” as it processes the Sun-Jupiter square. Jupiter represents “Expansion,” and the square from the Sun will trigger a conflict between demand expectations and actual supply reality. Bayer Rule 27 signals a definitive intraday reversal. Psychology is “skeptical.” Traders will use any early-morning spike to initiate short positions.
For a Detailed Day by Day Forecast with Neural Analysis Please watch the below video
MCX Crude Oil Gann Angle Chart
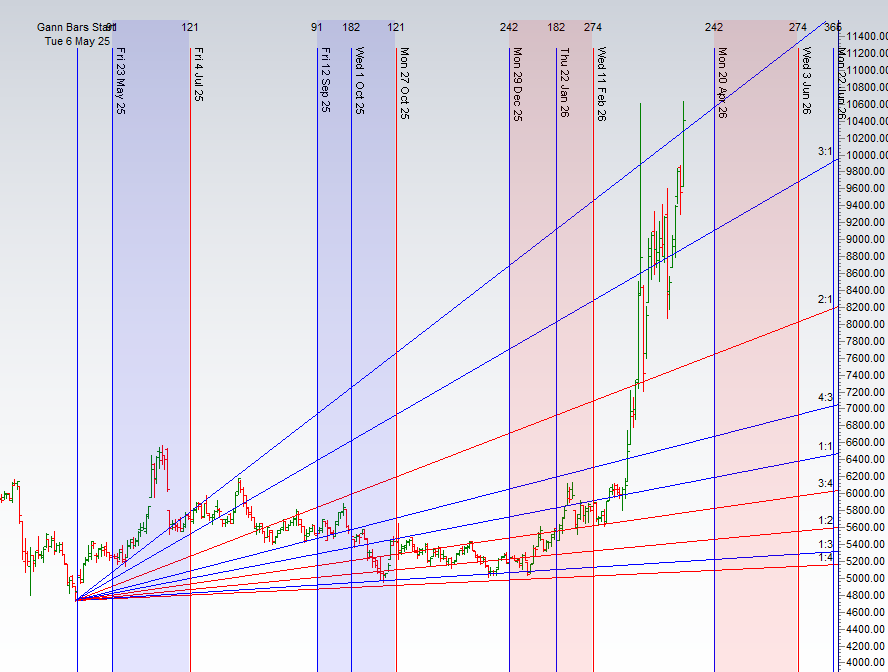
Crude is heading towards 4×1 gann angle resistance zone.
MCX Crude Oil Supply Demand Zone
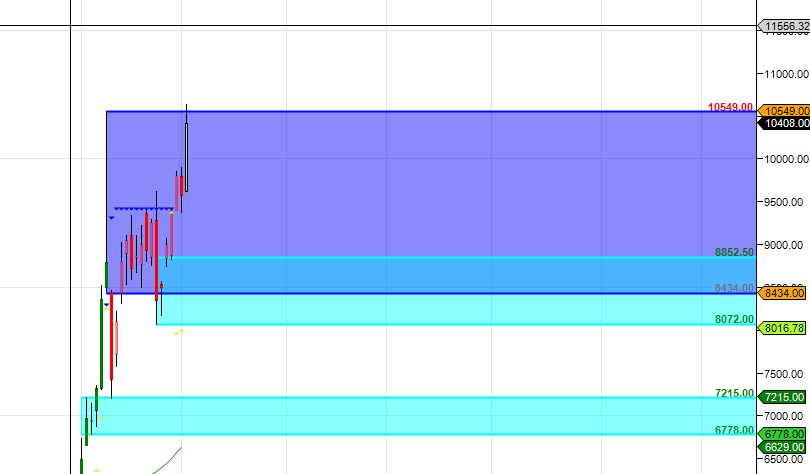
MCX CRUDE OIL Supply Demand Chart : Demand in range of 9800-9729 Supply in range of 10729-10800
MCX Crude Oil Crude Harmonic
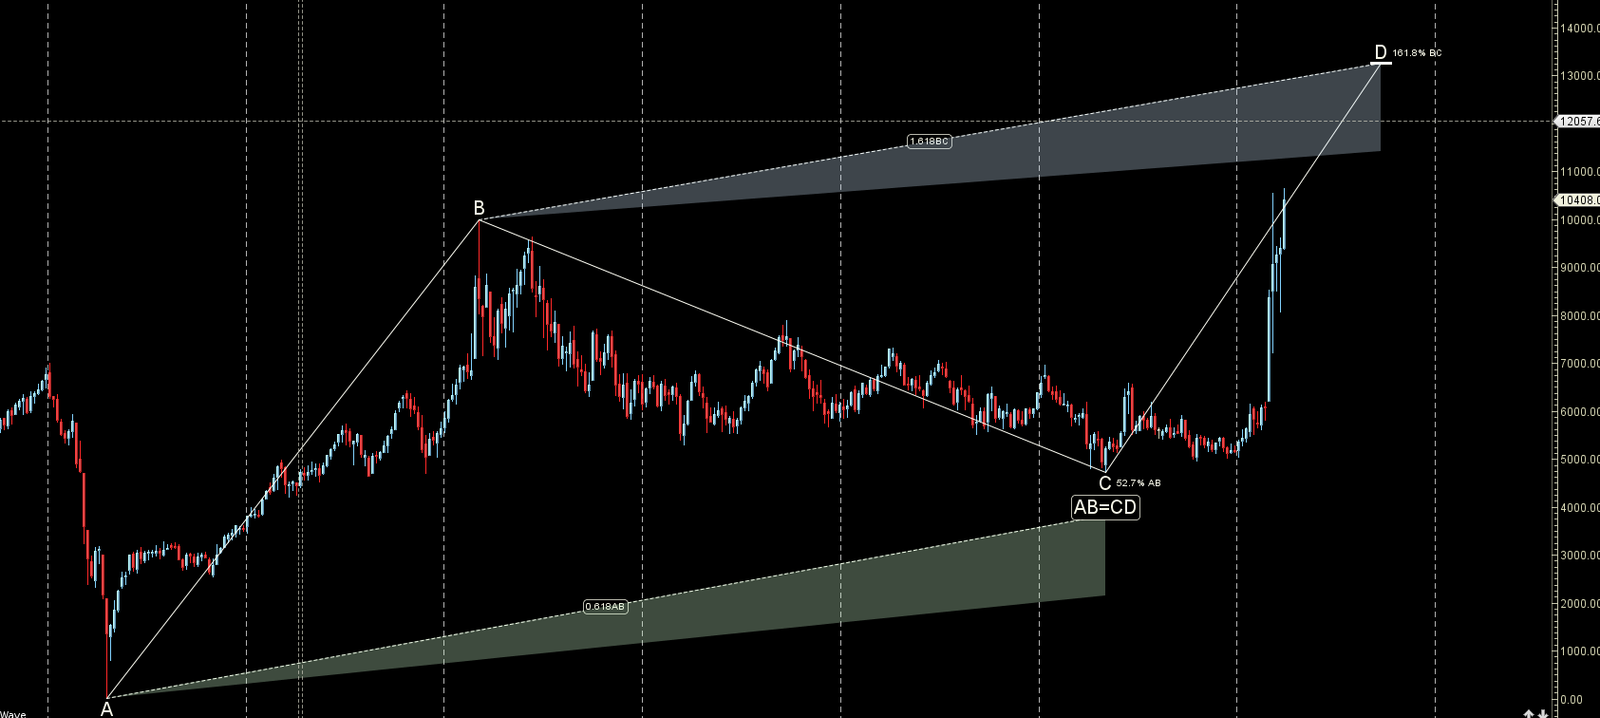
ABCD Pattern PRZ zone at 11000-11300
MCX Crude Oil Weekly
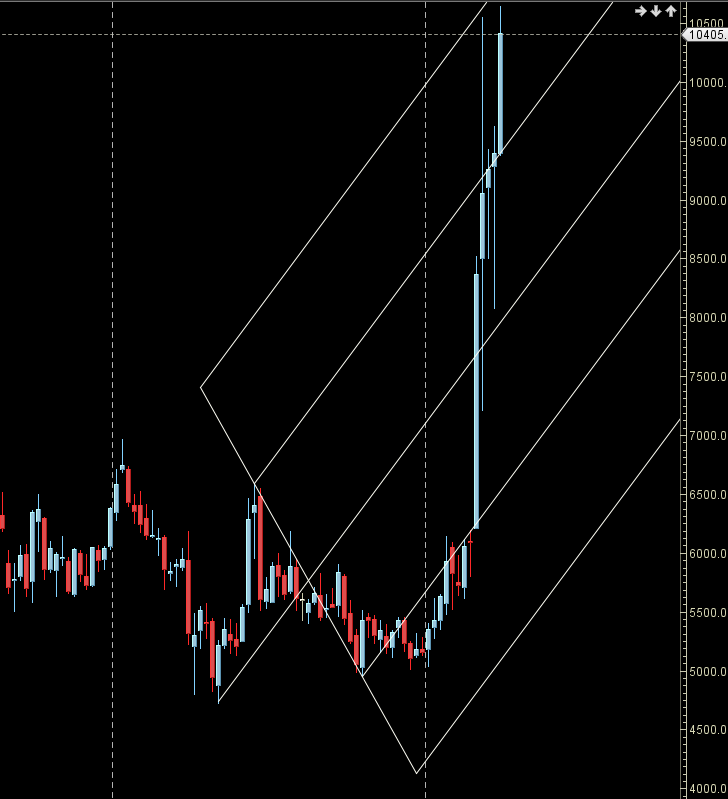
Price is back to AF resistance zone.
MCX Crude Oil Monthly
11300 is Monthly Resistance and 8775 is Monthly Support
Crude Astro/Gann Trend Change Date
Key Pivot Dates: Watch 06/09 April
CRUDE Weekly Levels
Weekly Trend Change Level: 10300
Weekly Resistance : 10504 10710 10918 11128
Weekly Support: 10098 9898 9700 9504
Levels Mentioned are for Current Month Future
Learn More:
W.D. Gann Trading Strategies – Learn how to decode markets using price, time, and geometry.
Trading Using Financial Astrology – Discover how planetary motion impacts market behavior and how to trade it effectively.
Ready to Trade Like a Time-Master?
Join our one-on-one mentorship to master astro-timing, Gann analysis, and institutional-grade setups.
Call: 09985711341
Email: bhandaribrahmesh@gmail.com
Wishing you good health and trading success as always.As always, prioritize your health and trade with caution.
As always, it’s essential to closely monitor market movements and make informed decisions based on a well-thought-out trading plan and risk management strategy. Market conditions can change rapidly, and it’s crucial to be adaptable and cautious in your approach.
Trade smartly and safely.