


The Great Unwinding: FIIs Take Massive Profits as a Violent Short Squeeze Unfolds
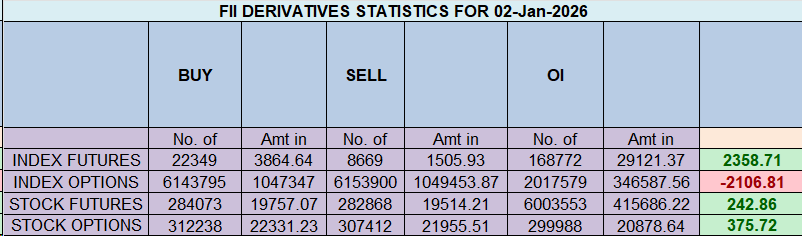
On January 2, 2026, the Nifty Index Futures market presented a spectacular and classic end-game scenario. While the headline deceptively showed Foreign Institutional Investors (FIIs) as massive net buyers of 12,269 contracts, a look beneath the surface reveals this was not a bullish endorsement but a strategic, profit-taking masterclass executed during a full-blown short squeeze.
The day’s most critical and revealing event was the colossal collapse in net Open Interest (OI), which plummeted by 9,154 contracts. This is the definitive sign of a market in full retreat, a massive deleveraging event, and the exhaustive end of the prior trend.
Decoding the Data: The Mechanics of a Violent Reversal
1. The FIIs’ “Deceptive” Buy: This is Cashing in the Chips, Not a New Bet
The granular FII data unmasks their true, brilliant strategy. They did not initiate a new bullish campaign. Instead, their “buying” was almost entirely driven by the covering of a staggering 11,142 short contracts.
This is not a new bull bet; it is the strategic closing of an immensely profitable bear campaign. After riding the trend down, they used the market’s upward panic to exit their positions. While they did add a small number of new longs (2,358), their primary action was to cash in their winning tickets. Their overall positioning remains profoundly bearish at 09:91 (ratio 0.12), proving they have not flipped their view, only secured their profits.
2. The Client: A Story of Capitulation and Panic-Chasing
The retail clients were on the wrong side of every move, showcasing classic end-of-trend psychology:
-
The Old Bulls Surrender: A large group of longs finally capitulated, covering 4,636 long positions, likely selling at the point of maximum pain right at the market’s turning point.
-
The New Bears Get Trapped: An even larger group, seeing the downtrend, turned bearish at the worst possible time, adding 7,999 new short contracts. They are now the primary fuel for the short squeeze.
3. The OI Collapse: A Hollow Market
The massive drop in Open Interest confirms that this was not a healthy rally fueled by new money. This was an exodus. The market “hollowed out” as old players (both FII shorts and client longs) rushed for the exits, leaving a brittle and illiquid structure behind.
Key Implications for the Market
-
A Textbook Short Squeeze: The rally is being driven by the panicked, forced buying of trapped short-sellers, not by new, confident bulls.
-
The Bear Trend Has Climactically Ended: The primary engine of the decline—aggressive FII shorting—is now reversing as they take profits. The selling pressure has climaxed and is now exhausted.
-
A Brittle and Dangerously Volatile Market: A rally on collapsing OI is the most fragile of all. Once the short-covering fuel is exhausted, the buying can evaporate instantly, making the market highly susceptible to a “rug pull” or sharp reversal.
-
The Bottoming Process is Underway: This type of climactic event typically signals that a major bottom is being carved out. However, this is rarely a clean, V-shaped recovery. Expect extreme volatility, sharp rallies, and deep retests as a new, more stable foundation is sought.
Conclusion
Disregard the headline FII “buy” figure as a sign of bullish conviction. The dominant and undeniable story is of a massive short squeeze facilitated by the capitulation of retail bulls, which allowed FIIs to execute a masterful profit-taking exit. The old bear trend is over, but the new rally is built on the weakest possible foundation. The risk of a continued, sharp decline has evaporated, replaced by the risk of extreme and unpredictable volatility.

Last Analysis can be read here
The Nifty has delivered a spectacular and textbook breakout, perfectly validating our previous analysis. The confluence of the NR21 pattern and the Mercury house change provided the explosive fuel for a powerful 180+ point rally, shattering resistance and carving out a new all-time high of 26,340. This showcases the immense predictive power of a combined astro-technical approach.
Now, having achieved this powerful breakout, the market finds itself at a new, and even more complex, inflection point. It is now caught between a surprisingly bullish geopolitical catalyst and a potent, historically significant astrological reversal signal. The market has arrived at a critical crossroads where the path of least resistance is no longer clear.
1. The Bullish Catalyst: A Paradoxical Geopolitical Positive
A major new geopolitical event has emerged with the developing conflict between the US and Venezuela. While global tension is often a risk-off signal, your analysis correctly identifies the unique, paradoxical benefit for India. A disruption in Venezuelan oil supply could lead to a fall in global crude oil prices, a major economic windfall for an energy-importing nation. This would directly and positively impact India’s current account deficit, strengthening the Rupee and providing a powerful fundamental tailwind for the entire market. This forms the basis of the strong, logical case for continued bullish momentum.
2. The Astrological Warning: Bayer Rule 6 and the Mars Reversal Point
Converging precisely with this bullish fundamental story is a powerful and cautionary astrological timing signal: Bayer Rule 6. This rule identifies a “significant reversal point” when the planet Mars transits through a specific and sensitive degree of the zodiac, as it is doing right now.
This creates the core conflict of the current setup. The market is basking in the euphoria of a new all-time high, backed by a positive economic story, yet it has simultaneously arrived at a pre-calculated cyclical point historically known for producing major trend reversals. Mars, the planet of action and conflict, will force a decisive resolution.
3. The Definitive Battleground: The 26,236 Line in the Sand
This powerful confluence of conflicting forces has created a new, high-stakes battlefield. The market’s reaction to a single, critical support zone will be the final verdict, revealing whether the bullish fundamentals or the bearish reversal cycle is the dominant force.
-
The Bullish Continuation Case: As long as the bulls can successfully defend the pivotal 26,236 support level, the bullish narrative will remain the primary trend. A hold here would suggest the market is absorbing the reversal energy and is using the positive fundamental news to launch the next leg of its rally, with targets at 26,441 and 26,521.
-
The Bearish Reversal Case: However, a decisive break and failure to maintain the 26,199 level would signal that the bearish power of the Mars cycle is overwhelming the bulls. This would be a major technical failure, inviting a wave of profit booking and targeting a swift decline towards 26,038 and a more significant fall to 25,958.
Conclusion
The Nifty is in a rare and powerful state of conflict, caught between a confirmed technical breakout with a bullish fundamental driver, and a sharp astrological reversal warning. The battle is now for control of this new, high-altitude trend, and it will be fought at the pivotal 26,236-26,199 zone. The price action here will provide the definitive clue as to which powerful force will dictate the market’s next major trend.
Bank Nifty 2026 Forecast: The W.D. Gann Master Roadmap for “The Year of the Whip”
Traders may watch out for potential intraday reversals at 09:18,11:56,01:09,02:08 How to Find and Trade Intraday Reversal Times
Nifty Dec Futures Open Interest Volume stood at 1.37 lakh cr , witnessing liquidation of 3 Lakh contracts. Additionally, the increase in Cost of Carry implies that there was closuer of SHORT positions today.
Nifty Advance Decline Ratio at 39:11 and Nifty Rollover Cost is @26141 closed above it.
In the cash segment, Foreign Institutional Investors (FII) sold 3268 cr , while Domestic Institutional Investors (DII) bought 1525 cr.
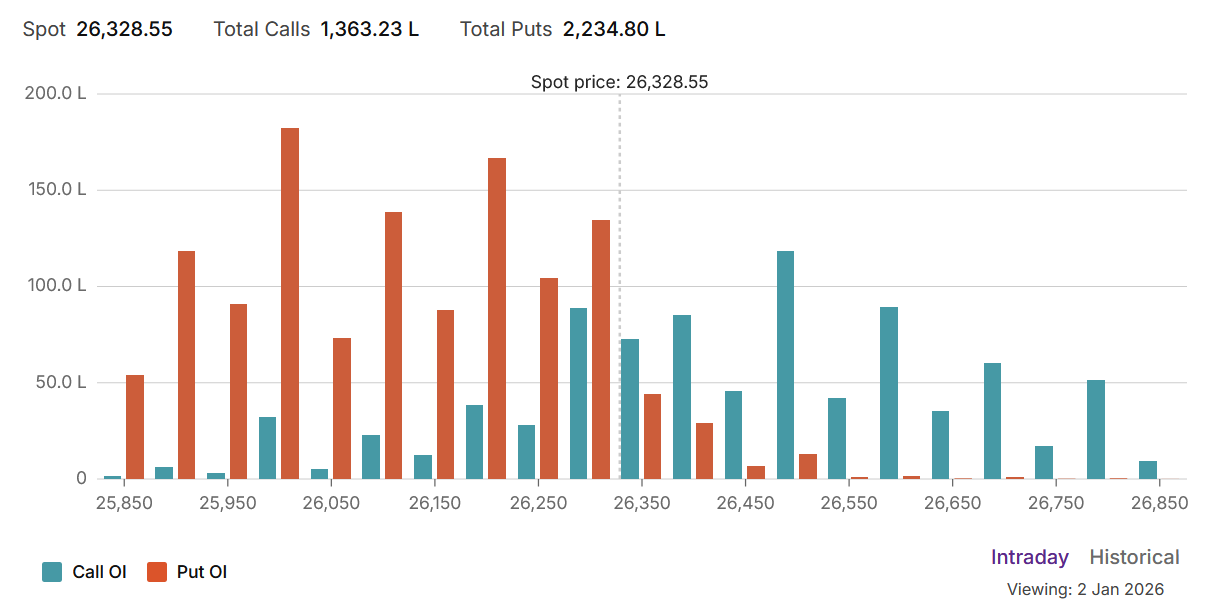
The Nifty options market is radiating a state of extreme bullish euphoria, a signal broadcasted emphatically by a massive Put-Call Ratio (PCR) of 1.63. This exceptionally high reading indicates a market operating with peak confidence and an almost complete absence of fear, driven by a tidal wave of aggressive put writing. This activity has constructed a colossal support structure beneath the index, showing a widespread belief that the market’s downside is firmly protected.
This bullish sentiment is strongly reinforced by the market’s current positioning. With the spot price at 26,328, the bulls have successfully conquered the Max Pain level of 26,300 and are holding this new high ground. The participant data reveals a classic “smart money” versus “retail money” divergence:
-
FIIs are unequivocally bullish, acting as net buyers of calls for upside participation and, more importantly, massive net sellers of puts, building the very support floor upon which this rally stands.
-
Retail, in contrast, is the primary source of the call supply, acting as significant net sellers of call options, betting that this rally will stall.
This divergence has forged a clear battlefield for the week:
-
Resistance: The primary resistance ceilings, defended by retail call sellers, are located at 26,400 and, more significantly, at the major psychological level of 26,500.
-
Support: The 26,300 Max Pain level has now flipped to become the immediate support pivot. Below this, a very strong support floor has been built at 26,200 and 26,000.
In conclusion, the Nifty is firmly in the hands of institutional bulls. The market is in a powerful “buy on dips” environment, and the path of least resistance is firmly to the upside, with the immediate battle being the bulls’ attempt to break the retail-defended resistance at 26,500.
For Positional Traders, The Nifty Futures’ Trend Change Level is At 26264. Going Long Or Short Above Or Below This Level Can Help Them Stay On The Same Side As Institutions, With A Higher Risk-reward Ratio. Intraday Traders Can Keep An Eye On 26411 , Which Acts As An Intraday Trend Change Level.
Nifty Spot – Intraday Chart Observation
Technical Setup: The index is approaching critical breakout levels. Watch these zones for price action confirmation:
-
Strength (Upside): Momentum is expected to pick up if Nifty sustains above 26350. In this scenario, the immediate resistance levels are 26404, 25460, and 26505.
-
Weakness (Downside): The trend technically weakens if the index slips below 26290 . This could open the path towards support levels at 26240, 26200, and 26166.
Wishing you good health and trading success as always.As always, prioritize your health and trade with caution.
As always, it’s essential to closely monitor market movements and make informed decisions based on a well-thought-out trading plan and risk management strategy. Market conditions can change rapidly, and it’s crucial to be adaptable and cautious in your approach.
► Join Youtube channel : Click here
► Check out Gann Course Details: W.D. Gann Trading Strategies
► Check out Financial Astrology Course Details: Trading Using Financial Astrology
► Check out Gann Astro Indicators Details: Gann Astro Indicators