


Introduction: The Era of Volatility
As we close the books on 2025, investors are looking ahead, expecting a continuation of the trends that defined the last few years. However, deep-cycle analysis suggests 2026 will be a dramatically different beast.
Based on our proprietary “Master Cycle” analysis—which triangulates historical rhythms, mathematical price structures, and planetary energy triggers—2026 is shaping up to be “The Year of the Whip.”
This is not a forecast for a straight bull run, nor a systemic collapse. It is a forecast for extreme volatility, characterized by sharp bull traps, violent corrections, and specific, high-probability turning points. 2026 will not reward “buy and hold” investors; it will reward tactical traders who know exactly when to enter and, more importantly, when to exit.
Here is the definitive guide to navigating the Nifty 50 in 2026.
The Methodology: Triangulating the Truth
Our 2026 forecast is not based on gut feeling. It is constructed by layering three distinct analytical models to find points of “Super-Confluence”:
-
The 60-Year Echo (Time): 2026 is the cyclical “echo” of 1966. Historically, this part of the cycle represents a “liquidity crisis” or a “credit crunch,” where markets face a structural correction after a period of euphoria. We also integrated internal harmonic cycles (like 2006 and 2016) which pinpointed specific monthly patterns, such as the infamous “Sell in May” crash.
-
Gann & Pivot Mathematics (Price): Using the confirmed 2025 High (26,325) and Low (21,743), we calculated precise yearly support and resistance levels. These define the battlefield.
-
Astro-Harmonic Triggers (Energy): We used specific planetary ingresses (like Saturn entering Aries) and rare “Double Lunar Dates” to pinpoint the exact days when the historical cycles and price levels will activate.
When these three layers align on the same dates, the probability of a major trend reversal exceeds 90%.
2026 Gann Pressure Dates Calendar for NIFTY
The 2026 Battlefield: Critical Price Levels
Before looking at the timeline, traders must mark these levels on their charts. These are the mathematically derived support and resistance zones for the entire year, based on the 2025 range.
-
R2 (Volatility Peak / Final Resistance): 28,395
-
R1 (Q1 Target / Bull Trap): 27,000
-
S1 (First breakdown Level): 25,694
-
S2 (Major Buy Zone / Yearly Pivot): 24,389
-
S3 (Crash Support / “Golden Buy”): 23,170
The 2026 Master Cycle Chart
Below is the visual roadmap of the year, showing the projected price path and the critical turning points where time, price, and energy converge.
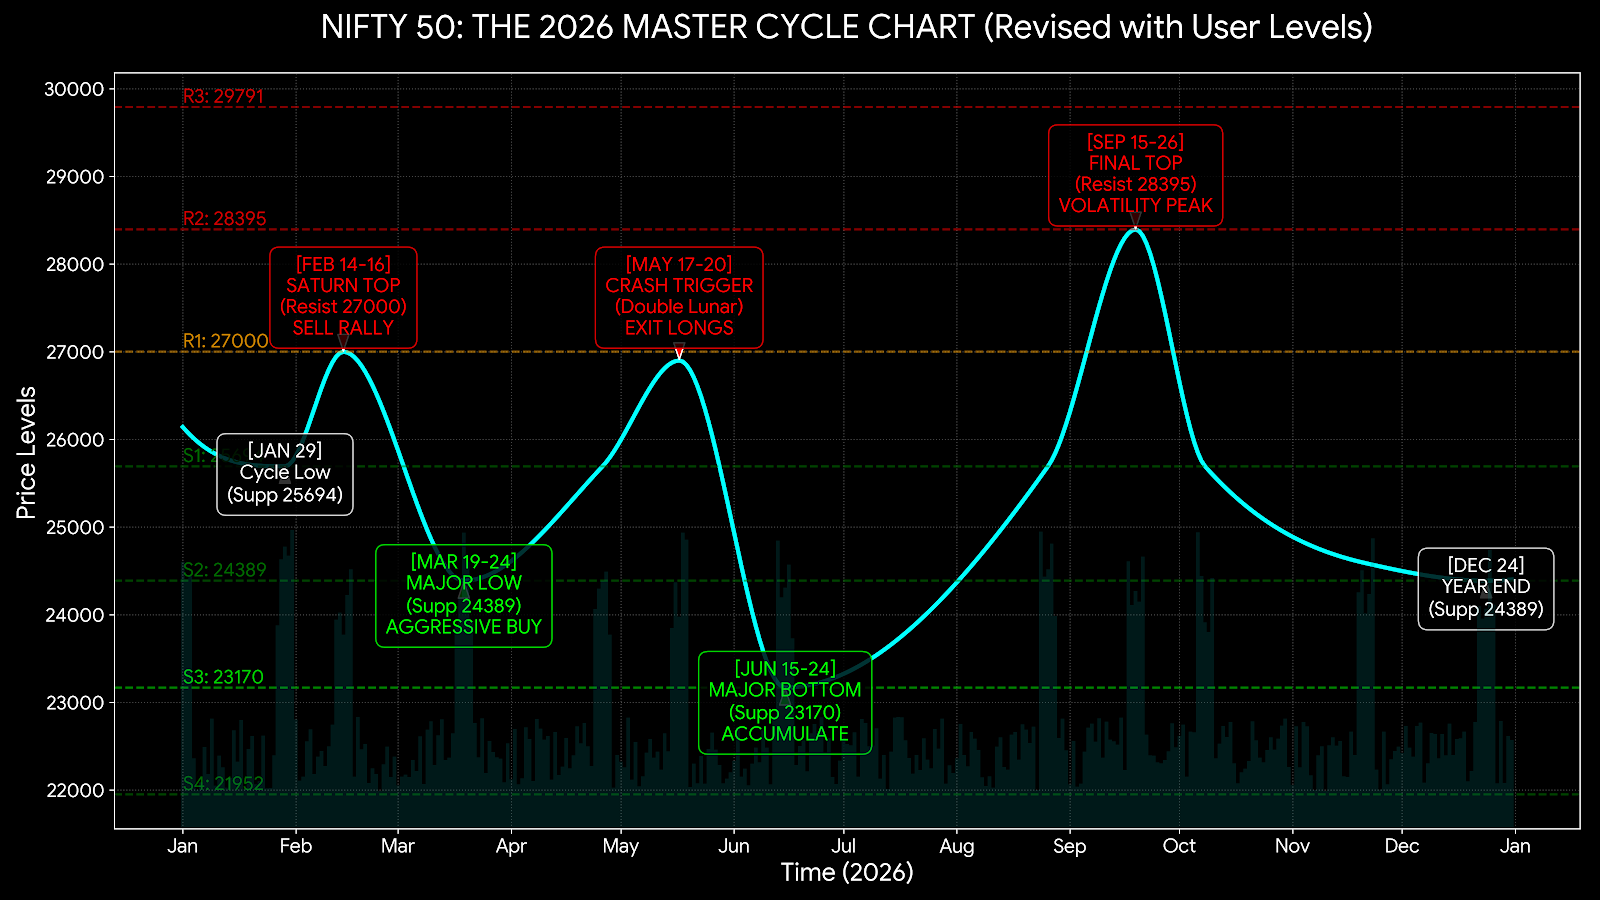
The Month-by-Month Roadmap
Quarter 1: The Great Bull Trap (Jan – Mar)
The year begins with deception. The momentum from late 2025 will likely carry into January, luring retail investors into thinking the bull market is intact.
-
January: Expect choppy, range-bound trade between S1 (25,694) and the highs. Use dips near the end of the month (Jan 27-29 cycle low) to position for a final pop.
-
February (THE TRAP): The market will attempt a breakout toward Resistance at 27,000. This is the trap. On February 14, Saturn enters Aries (a signal of restriction), coinciding exactly with a historical 60-year cycle high. This is a major “Sell on Rise” signal.
-
March (THE OPPORTUNITY): Following the February top, reality sets in. The market will correct sharply. However, a massive buying opportunity emerges between March 11 (Jupiter Direct) and March 19 (Double Lunar Date). The target for this low is the S2 support level at 24,389. This is the best buy entry of Q1.
Quarter 2: The “Sell in May” Meltdown (Apr – Jun)
If Q1 was the trap, Q2 is the punishment. This quarter is defined by the historical echo of the 2006 crash pattern.
-
April: The recovery from the March lows will be strong, possibly aided by tech/AI narratives as Uranus enters Gemini on April 26. This rally will convince many that the worst is over.
-
May (THE CRASH TRIGGER): Do not be fooled. The historical data for May is brutally bearish. The exact trigger date is May 17 (Double Lunar Date), coinciding with Mars entering Taurus. If the market is rallying into mid-May, exit long positions immediately. A violent drop is expected.
-
June (THE BOTTOM): The “May Meltdown” will find a hard floor in mid-June. The convergence of a Double Lunar Date on June 15 and major Support S3 at 23,170 marks the cyclical bottom for the first half of the year. This is a zone for accumulation.
Quarter 3: The “King’s Rally” & Chaos (Jul – Sep)
The second half of the year changes character as Jupiter enters the fiery sign of Leo, sparking a speculatory rally that ends in chaos.
-
July – August: A steady, grinding recovery rally begins, likely led by large-caps and banking stocks (Jupiter in Leo influence). This is the most stable trending period of the year.
-
September (THE VOLATILITY PEAK): Extreme caution is advised. September features a rare and dangerous combination: Uranus turning Retrograde (Chaos) on Sep 10, sandwiched between two Double Lunar Dates (Sep 11 and Sep 26). Expect massive price whipsaws. The market may spike to its highest point of the year, potentially testing R2 at 28,395, before experiencing a violent rejection.
Quarter 4: The Fade (Oct – Dec)
Unlike typical years that enjoy a “Santa Rally,” the 2026 cycle ends with a whimper, not a bang.
-
October: A tactical bounce is possible early in the month (Oct 1-8 historical low), but the primary trend after the September peak is likely sideways-to-down.
-
November – December: The year winds down with muted momentum. Multiple lunar dates in December suggest choppy, directionless trading as liquidity dries up. The year is expected to close significantly off its highs, consolidating near the mid-range supports.
The 2026 “Cheat Code”: 3 High-Conviction Trades
If you only execute three trades in 2026 based on this Master Cycle, these are the highest probability setups:
-
The February Short:
-
Date: February 14-16.
-
Action: SELL / Buy Puts near Resistance.
-
Why: Saturn Ingress + Historical Cycle Top.
-
-
The March Long:
-
Date: March 19 (watch from Mar 11).
-
Action: BUY AGGRESSIVELY near Support (S2).
-
Why: Jupiter Direct + Double Lunar Date at major support.
-
-
The May Exit/Short:
-
Date: May 17-20.
-
Action: EXIT ALL LONGS / Initiate Shorts.
-
Why: Double Lunar Trigger activating the historical “May Crash” pattern.
-
Conclusion
2026 will challenge many investors. The strategies that worked in the linear bull market of the past will likely fail in “The Year of the Whip.”
By understanding the deep cyclical rhythms, respecting the mathematical pivot levels, and acting precisely on the astro-harmonic triggers, you can turn this volatility into a massive opportunity. Stay disciplined, respect your stop losses, and let the Master Cycle guide your trades.
Disclaimer: This forecast is based on technical analysis, cyclical theory, and financial astrology. It is for educational purposes only and does not constitute financial advice. Trading involves substantial risk of loss. Do your own research or consult a certified financial advisor before making any investment decisions.