


A Market on the Brink: FIIs Hold the Line as Retail Bulls Begin to Capitulate
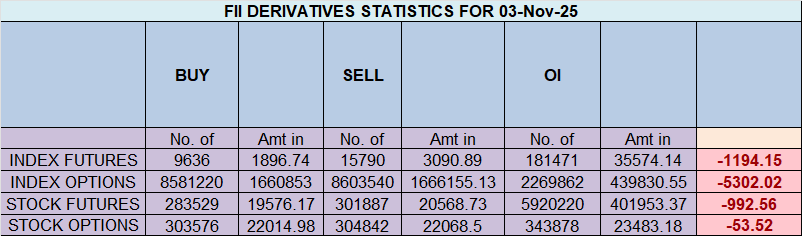
On November 3, 2025, the Nifty Index Futures witnessed a pivotal battle that hints at a significant turn. While the headline shows Foreign Institutional Investors (FIIs) moderately increasing their bearish stance with a net short of 6,791 contracts worth ₹1,317 crore, the truly explosive story is found in the client behaviour: a massive wave of long liquidation, with clients covering an enormous 15,914 long contracts.
This is not a market of building conflict. This is the first tremor of a potential bullish surrender. The data indicates that the relentless pressure from institutional sellers is finally beginning to break the will of the retail bulls.
(Note: There appears to be a contradiction in the provided granular FII data, as “covering 14,287 short contracts” would not result in a net short position. The analysis will proceed based on the headline net FII action and the client data, which present a consistent and powerful narrative.)
Decoding the Data: The Cracks in the Armor
1. Client Capitulation: The Great Unwinding
The single most important event of the session was the client behavior. By covering 15,914 long contracts, a massive number of retail and HNI participants who were betting on a rally have headed for the exits. This is the clearest signal yet of capitulation and fear entering the retail mindset. This “long unwinding” is highly significant because:
-
It removes buying support from the market.
-
The selling from exiting longs adds significant downward pressure on the price.
-
It indicates that the pain of holding long positions against the institutional selling has become too great.
2. FII Stance: The Unwavering Bears
The FIIs remain the immovable object of bearish conviction. Despite the market turmoil, their positioning has become even more extreme, settling at a stark 16% long versus 84% short. Their net shorting activity on the day, combined with this extreme positioning, shows they are not backing down. They view any market weakness not as a reason to take profit, but as a confirmation of their thesis, and are using the exit of retail longs to press their advantage.
3. Open Interest and Final Positioning: The Divergence Reaches a Climax
Even with the huge exit of client longs, the net open interest still rose by 6,645 contracts. This means that for every long that was closed, an even greater number of new, aggressive short positions were opened elsewhere in the system, likely by the FIIs and other proprietary desks. The market participation is increasing, but it is heavily skewed towards the sell side.
The final positioning is a textbook setup for a major trend move:
-
FIIs (Smart Money): At an extremely bearish long-short ratio of 0.20, they are positioned for a significant decline.
-
Clients (Retail Money): Still overwhelmingly bullish at a ratio of 1.98, holding 68% of their positions as longs.
Key Implications for Traders
-
A Major Warning Signal is Flashing: The client long liquidation is a significant red flag. When the “weak hands” who were stubbornly bullish begin to sell in large numbers, it is often a precursor to an accelerated move in the direction of the institutional pressure.
-
The Path of Least Resistance is Down: With a primary source of buying support now turning into sellers, the market structure has been critically weakened. Rallies are likely to be short-lived and met with fresh selling.
-
The Risk of a Liquidation Cascade: The crucial question now is the pain threshold for the remaining 68% of client longs. If prices continue to fall, it could trigger another, even larger wave of panic selling, leading to a liquidation cascade that feeds on itself.
-
Contrarian Signal at an Extreme: The divergence between smart money positioning (FIIs) and retail positioning (Clients) is at a maximum. Historically, such extreme divergences are resolved in favour of the institutional players.
Conclusion
Do not be fooled by the moderate FII net short number. The dominant story of the day is the crack in the retail bullish consensus. The massive liquidation of client long positions is the most significant development, indicating that the FIIs’ persistent bearish pressure is working. The market is now in a fragile and dangerous state, highly vulnerable to a sharp, accelerated decline as the remaining retail longs are tested. The bears are in clear control of the internal dynamics.
Last Analysis can be read here
Following a two-day decline, the Nifty has entered a state of tense equilibrium, forming a small, indecisive candle. This pattern represents a momentary truce in the market, a pause where selling pressure has abated but buyers still lack the conviction for a decisive reversal. However, this deceptive calm is unlikely to last, as a powerful astrological catalyst is set to inject a surge of new energy into the market.
1. The Astrological Trigger: Mars Ingress Unleashes Aggression
Today is marked by a Mars Ingress, a significant event where the planet Mars moves into a new zodiacal sign. Mars is the planet of energy, action, conflict, and aggression. After yesterday’s quiet, range-bound session, this ingress is expected to act as a powerful trigger, breaking the market’s stalemate. The quiet consolidation is over; the Mars energy will fuel a decisive, high-conviction move as both bulls and bears are energized to act on their positions with renewed aggression.
2. The Technical Battleground: The 25,800 – 25,700 Zone
The aggression fueled by Mars will be focused on a clearly defined battleground, supported by multiple technical studies. This zone will be the focal point of the day’s entire conflict:
-
The Bullish Objective (25,800): For the bulls, reclaiming the 25,800 level is the primary objective. A decisive break and hold above this level would signal that the recent downturn was merely a correction, invalidating the bearish pressure and potentially trapping shorts. This is the key upside barrier they must overcome.
-
The Bearish Line in the Sand (25,700): For the bears, a breakdown below the critical support at 25,700 is the goal. A sustained move below this level would confirm that the two-day fall was the start of a new downward leg, likely triggering a fresh wave of selling as the last of the support gives way.
3. The Intraday Game Plan: Capturing the Mars-Fueled Trend
Given the expectation of a volatile, trend-setting day, a disciplined intraday strategy is essential to avoid getting caught in the initial chaos. The “First 15-Minute” rule provides a clear framework for action:
-
Mark the Opening Range: Traders should watch the first 15 minutes of the session and mark the high and low of that period. This “initial balance” will reveal the first aggressive push of the day.
-
Trade the Breakout:
-
A decisive move above the 15-minute high serves as a trigger to join the bulls, anticipating a powerful trend day towards and potentially beyond the 25,800 resistance.
-
A decisive move below the 15-minute low serves as a trigger to join the bears, confirming a breakdown of 25,700 and positioning for further downside.
-
Conclusion
The Nifty is perfectly coiled for a significant, high-energy move. The indecision of yesterday’s small candle has set the stage, and the Mars ingress today provides the catalyst for aggression and a decisive trend. The battle lines are clearly drawn at 25,800 and 25,700. By watching the opening 15-minute range, traders can get a clear signal of which side is winning the battle and position themselves to ride the day’s trend. Prepare for a session of increased volatility and directional conviction.
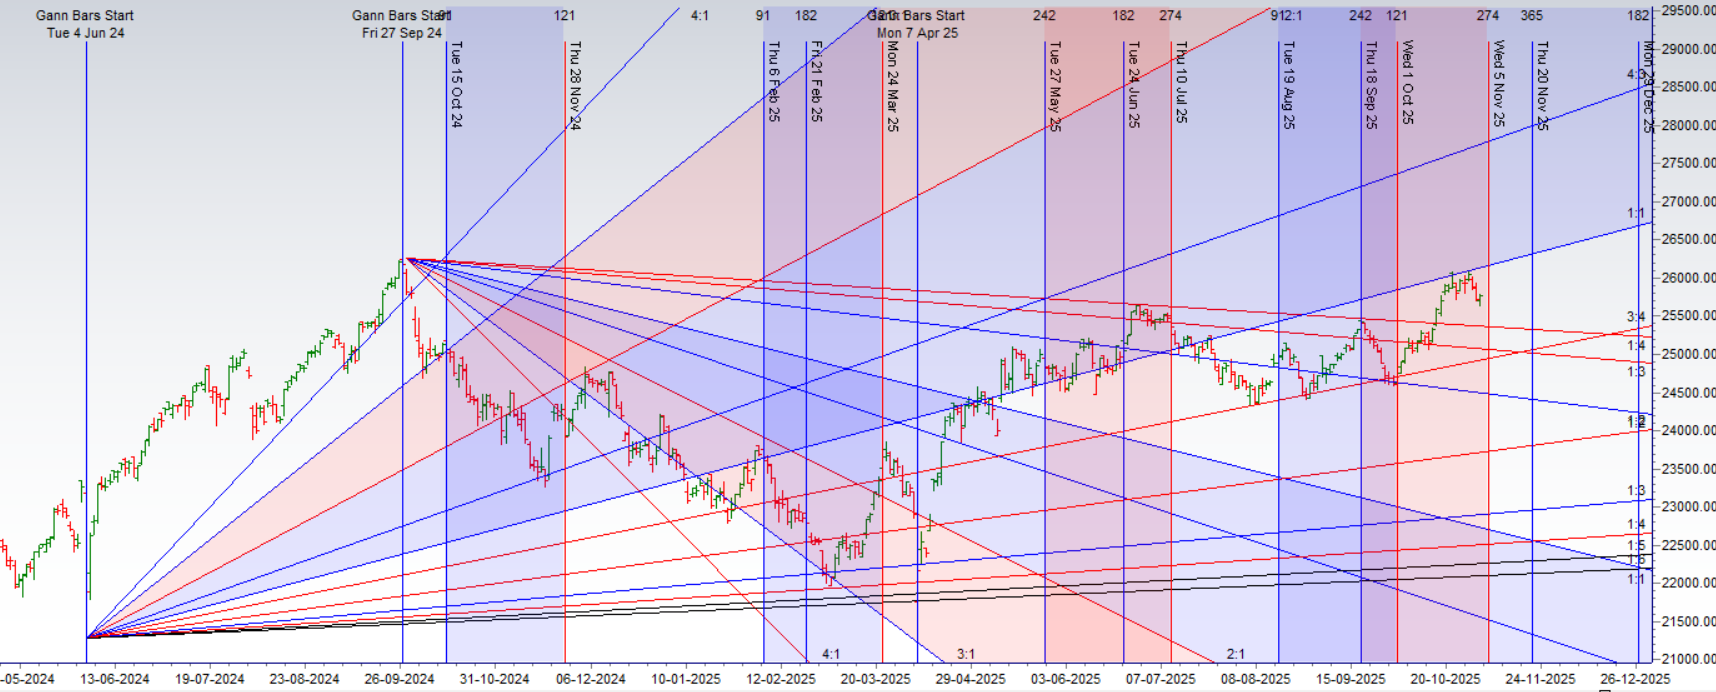
Nifty Trade Plan for Positional Trade ,Bulls will get active above 25805 for a move towards 25885/25965. Bears will get active below 25700 for a move towards 25619/25538
Traders may watch out for potential intraday reversals at 10:44,12:04,01:11,02:27 How to Find and Trade Intraday Reversal Times
Nifty Oct Futures Open Interest Volume stood at 1.67 lakh cr , witnessing liquidation of 1 Lakh contracts. Additionally, the increase in Cost of Carry implies that there was closeure of LONG positions today.
Nifty Advance Decline Ratio at 29:20 and Nifty Rollover Cost is @26104 closed above it.
In the cash segment, Foreign Institutional Investors (FII) sold 1883 cr , while Domestic Institutional Investors (DII) bought 3516 cr.
Market Analysis: A Bearish Grip Tightens as a “Wall of Calls” Caps the Upside
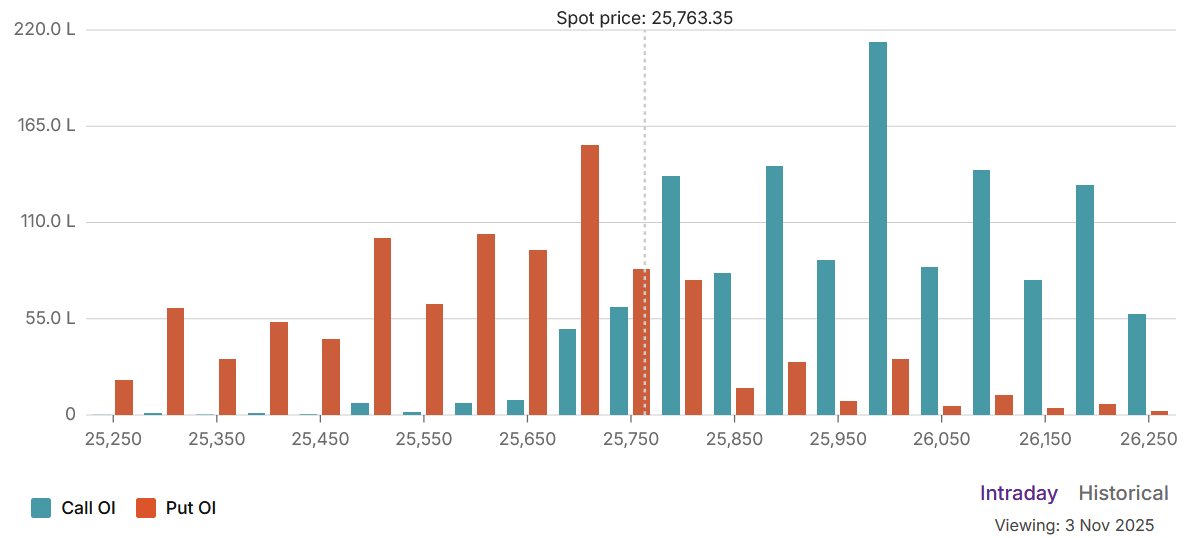
The options market data for November 3, 2025, paints a clear and compelling picture of a market under significant bearish pressure. A deeply negative Put-Call Ratio (PCR) of 0.65 and a massive buildup of Call Open Interest (OI) signal that sellers are in firm control. With the spot price at 25,763, the market is pinned below a formidable resistance ceiling, with retail participants aggressively buying insurance against a further decline.
The Option Chain Landscape: A Ceiling of Resistance and a Floor of Hope
The OI chart tells a powerful visual story. An imposing “Wall of Calls” stands at the 26,000 strike, which has the highest concentration of open interest across the entire chain. This level represents a massive barrier where a large number of option sellers (writers) are betting that the price will not reach by expiry. Further significant Call OI is also visible at 25,800 and 25,900, creating multiple layers of resistance.
On the downside, the bulls have established their primary line of defense at the 25,700 strike, which holds the highest Put OI. This level acts as a critical support floor, with a secondary, even stronger, support level visible at 25,500. The current spot price is precariously positioned right above this key support, while the Max Pain level of 25,800 acts as a gravitational magnet, pulling the market towards a point of maximum financial pain for option buyers.
Participant Behavior: A Tale of Retail Fear and Institutional Control
The true dynamic is revealed in the activity of different market participants:
-
Retail’s Rush to Protection: The most dramatic signal of the day is the behavior of retail clients. They initiated a massive wave of bearish bets by adding 464,000 long put contracts. This is a classic sign of fear, where traders are either protecting their portfolios from a fall or are aggressively speculating on a sharp move down. This aggressive put buying shows a significant loss of bullish conviction.
-
FIIs as the “House”: Foreign Institutional Investors are playing a calculated, bearish-to-neutral game. Their most significant action was shorting 52,800 call contracts. By selling calls, they are actively constructing the resistance wall at higher strike prices, collecting premium from buyers with a strong conviction that the market lacks the momentum to rally. Their actions on the put side were more balanced, suggesting they are not expecting a complete collapse but are firmly positioned to cap any potential upside.
Key Levels to Watch:
-
Major Resistance: 26,000. Breaking this level would require immense buying pressure to overcome the massive wall of short positions.
-
Immediate Resistance: 25,800. The Max Pain level, coupled with heavy Call OI, makes this the first key barrier.
-
Immediate Support: 25,700. The highest Put OI forms a critical floor. A break below this would be a major victory for the bears.
-
Major Support: 25,500. This is the next significant support level that bulls will attempt to defend.
Conclusion
The market is caught in a classic bear grip. The sentiment, as measured by the low PCR, is negative. The positioning, as seen in the towering wall of calls, confirms a lack of upside momentum. And the activity, defined by retail’s fearful put buying and the FIIs’ strategic call selling, reinforces this bearish narrative. The path of least resistance is sideways to down, with the market likely to remain pinned below 25,800. A sustained rally appears highly improbable without a fundamental catalyst strong enough to force the institutional sellers at 26,000 to abandon their profitable positions.
For Positional Traders, The Nifty Futures’ Trend Change Level is At 26047. Going Long Or Short Above Or Below This Level Can Help Them Stay On The Same Side As Institutions, With A Higher Risk-reward Ratio. Intraday Traders Can Keep An Eye On 25878 , Which Acts As An Intraday Trend Change Level.
Nifty Expiry Range
Upper End of Expiry : 25934
Lower End of Expiry : 25592
Nifty Intraday Trading Levels
Buy Above 25800 Tgt 25829, 25888 and 25934 ( Nifty Spot Levels)
Sell Below 25729 Tgt 25700, 25666 and 24624 (Nifty Spot Levels)
Wishing you good health and trading success as always.As always, prioritize your health and trade with caution.
As always, it’s essential to closely monitor market movements and make informed decisions based on a well-thought-out trading plan and risk management strategy. Market conditions can change rapidly, and it’s crucial to be adaptable and cautious in your approach.
► Join Youtube channel : Click here
► Check out Gann Course Details: W.D. Gann Trading Strategies
► Check out Financial Astrology Course Details: Trading Using Financial Astrology
► Check out Gann Astro Indicators Details: Gann Astro Indicators