FIIs’ Bearish Signal is Deeper Than It Looks: A Story of Bullish Capitulation
On the surface, the data from the Bank Nifty Index Futures on October 14, 2025, shows a straightforward bearish day for Foreign Institutional Investors (FIIs). They were net shorters of 1,097 contracts, valued at ₹217 crores. However, the true and far more alarming story lies in the second data point: the net open interest (OI) decreased by 527 contracts.
This combination—net shorting accompanied by a fall in open interest—is a complex but incredibly powerful signal. It tells us that the dominant activity of the day was not the aggressive initiation of new bearish bets, but rather the capitulation and liquidation of existing bullish positions.
Unmasking the True Motivation: It’s About Abandonment
Here is the crucial distinction:
When FIIs short and OI increases, they are aggressively adding new bets on a decline.
When FIIs short and OI decreases, it means the primary activity was the closing of existing positions, and the selling from closing long contracts overwhelmed all other activity.
In simple terms, this was a day of bullish abandonment. The FIIs have lost faith in the upside potential. They are not just hedging or adding a few tactical shorts; they are actively dumping their long positions, likely using any minor intraday strength as an opportunity to sell and get out. The net short figure is merely the mathematical result of this large-scale liquidation of longs.
Key Implications for Traders:
A More Profound Bearish Signal: This is arguably a more bearish signal than simple short-selling. An FII adding a new short is betting on a decline. An FII liquidating its longs is making a statement that it sees no further hope for an upside move. They are removing their bullish bets from the table entirely.
Removal of a Key Support Layer: As long as FIIs held a significant number of long positions, there was an incentive for them to defend key support levels to protect those positions. By liquidating their longs, they have removed that layer of potential institutional support. The market is now structurally more vulnerable to declines.
A Potential Trap for Retail: This type of action can be deceptive. The price action during a session dominated by long liquidation can be choppy rather than a straight-line decline. This can lure in retail buyers who see a “dip” and are effectively buying the very positions that the institutional players are desperate to unload.
Conclusion:
Do not misinterpret the data as just another day of FII selling. The decrease in open interest is the key that unlocks the real story. This was a session defined by bullish capitulation from the smart money. They are actively de-risking and abandoning their long positions, signaling a profound lack of confidence in the market’s ability to rally. This action has left the Bank Nifty in a more fragile and precarious position, with the risk now heavily skewed to the downside. Exercise extreme caution.
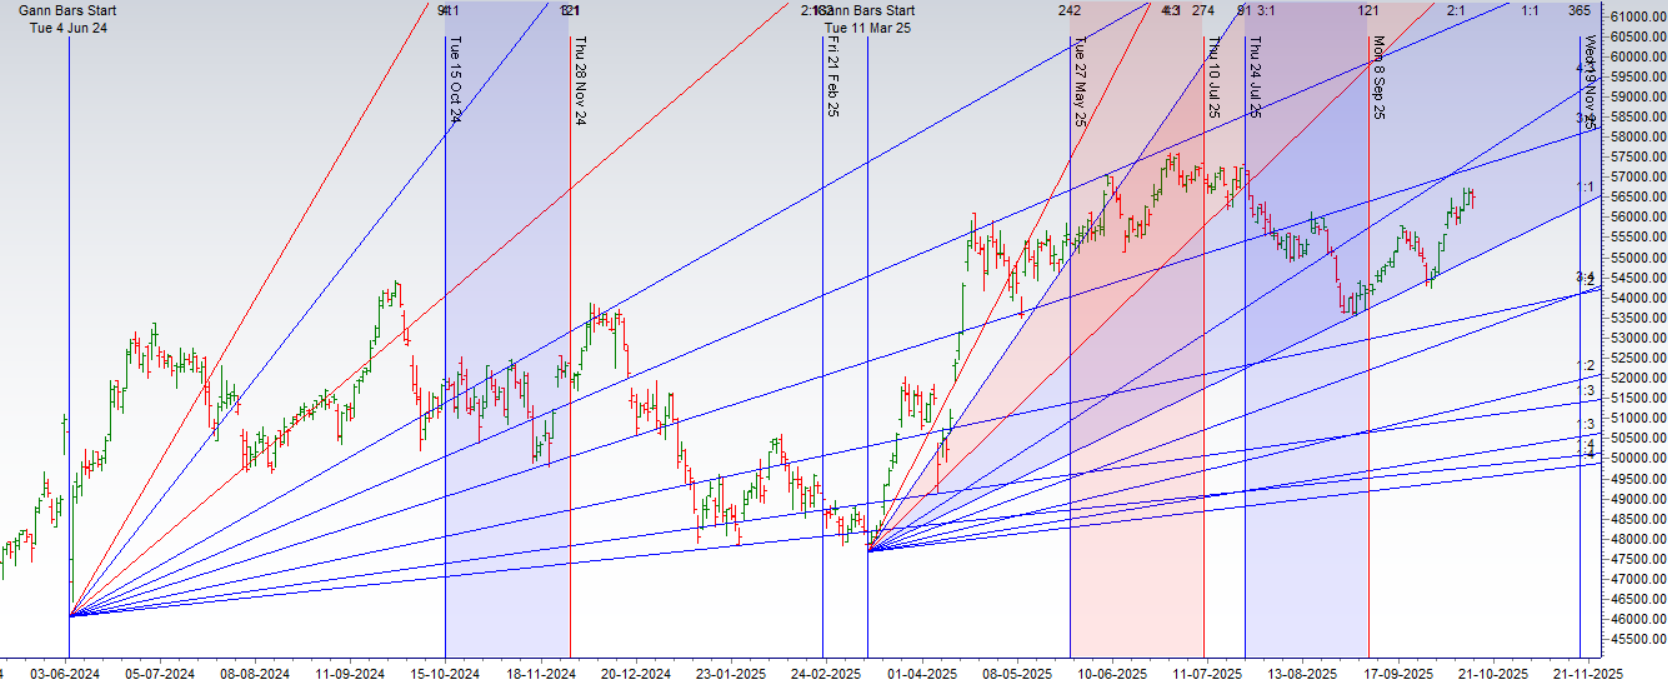
After a period of strong, directional movement, the Bank Nifty has come to a dramatic and perfect halt. Today’s session saw the formation of a textbook Doji candlestick, a rare and powerful sign of absolute market equilibrium. This is not just a random pause; its significance is magnified exponentially because it has occurred on a key pre-identified astrological date: the Venus Ingress.
This confluence of a perfect pattern on a precise timing event is a classic and unambiguous signal that the market is at a critical inflection point, and is very often a precursor to a significant, high-velocity move.
The Anatomy of the Doji: A Market in Perfect Equilibrium
A Doji is formed when an asset’s opening and closing prices are virtually identical, creating a candlestick with long wicks and a very small (or non-existent) body. It represents a moment of perfect and tense indecision—a tug-of-war where neither the bulls nor the bears could gain any ground by the end of the session.
After a sustained uptrend, the appearance of a Doji is a major red flag for the bulls. It signifies that the powerful buying momentum that drove the trend has completely evaporated and has been met by an equal and opposite selling force. The trend is no longer in control; the market is now in a state of a perfect stalemate.
The Catalyst: The Significance of the Venus Ingress
What elevates this from a standard technical pattern to a high-probability setup is its timing. The Doji has formed precisely on the day of a Venus Ingress. In financial astrology, Venus governs the banking and financial sectors. An ingress, where the planet changes signs, is known to trigger a shift in sentiment, value perception, and trend for the assets it rules.
The formation of a pattern of pure indecision (the Doji) on a date that is known for a “change of sentiment” (the Venus Ingress) is not a coincidence. It is a powerful confluence that tells us this pause is meaningful. The market is absorbing the new energy of the ingress before deciding on its next major directional path.
The Strategic Implication: A Precursor to a Major Move
A market, especially one as volatile as the Bank Nifty, cannot remain in a state of perfect equilibrium for long. A Doji represents a coiling of energy, a market winding up like a spring before it is released. The indecision must be resolved, and this resolution is typically sharp, swift, and directional.
This setup provides traders with a clear and strategically advantageous scenario. The battle lines have been drawn with mathematical precision by the high and low of the Doji itself.
The Bullish Trigger: A decisive move and close above the high of the Doji would signal that the bulls have won the stalemate, absorbed the selling pressure, and are ready to resume the uptrend with renewed force.
The Bearish Trigger: A decisive move and close below the low of the Doji would signal that the bears have taken control. This would confirm that the uptrend has been successfully halted and that a new downward leg is likely beginning.
Conclusion:
This is not the time for complacency. The Bank Nifty has printed a perfect Doji on a key astrological date, a combination that screams “prepare for volatility.” The period of quiet indecision is about to end. The breakout or breakdown from the Doji’s range will likely be the starting gun for the market’s next significant, high-momentum move. Watch the high and low of today’s session with extreme vigilance.
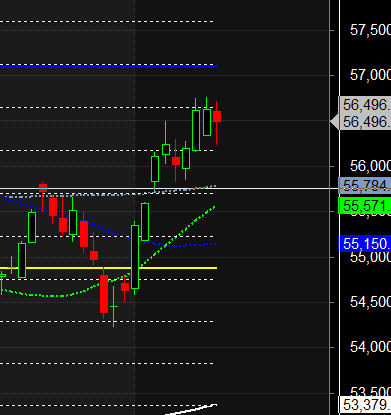
Bank Nifty Trade Plan for Positional Trade ,Bulls will get active above 56671 for a move towards 56907/57143. Bears will get active below 56435 for a move towards 56199/55963.
Bank Nifty Oct Futures Open Interest Volume stood at 16.6 lakh, with liquidation of 0.89 Lakh contracts. Additionally, the Increase in Cost of Carry implies that there was a closeure of LONG positions today.
Bank Nifty Advance Decline Ratio at 03:09 and Bank Nifty Rollover Cost is @55170 closed above it.
BANK Nifty Gann Monthly Trend Change level 54422 closed above it.
Bank Nifty closed above its 21SMA @56000,Trend is Buy On Dips till above 56000
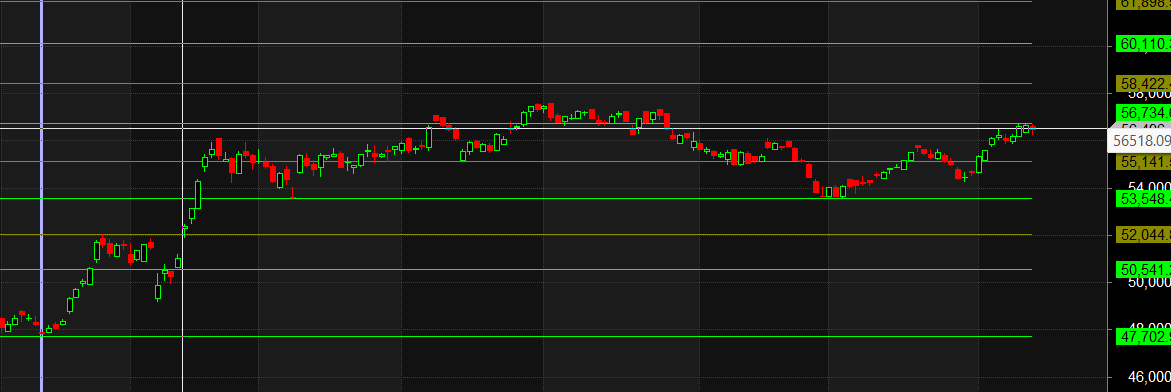
Traders who follow the musical octave trading path may find valuable insights in predicting Bank Nifty’s movements. According to this path, Bank Nifty may follow a path of 53548-55141-56734-58422. This means that traders can take a position and potentially ride the move as Bank Nifty moves through these levels. Of course, it’s important to keep in mind that trading is inherently risky and market movements can be unpredictable.
According to the Bank Nifty options chain, the call side has the highest open interest (OI) at the 56500 strike, followed by the 57000 strike. On the put side, the 56000 strike has the highest OI, followed by the 55500 strike.This indicates that market participants anticipate Bank Nifty to stay within the 56000-57000 range.
The Bank Nifty options chain shows that the maximum pain point is at 56200 and the put-call ratio (PCR) is at 0.96Typically, when the PCR open interest ranges between 0.90 and 1.05, the market tends to remain range-bound. PCR is on extreme end suggesting we can see sharp reversal .
Successful trading requires a deep understanding of the market, a solid strategy, and, most importantly, a well-prepared http://mindset.it demands concentration, preparation, and an awareness of the psychological challenges that come with it.
For Positional Traders, The Bank Nifty Futures’ Trend Change Level is At 56182 . Going Long Or Short Above Or Below This Level Can Help Them Stay On The Same Side As Institutions, With A Higher Risk-reward Ratio. Intraday Traders Can Keep An Eye On 56680, Which Acts As An Intraday Trend Change Level.
Wishing you good health and trading success as always.As always, prioritize your health and trade with caution.
As always, it’s essential to closely monitor market movements and make informed decisions based on a well-thought-out trading plan and risk management strategy. Market conditions can change rapidly, and it’s crucial to be adaptable and cautious in your approach.