


An Epic Short Squeeze: FIIs’ Colossal Buying is a Profit-Taking Event, Not New Bullish Conviction
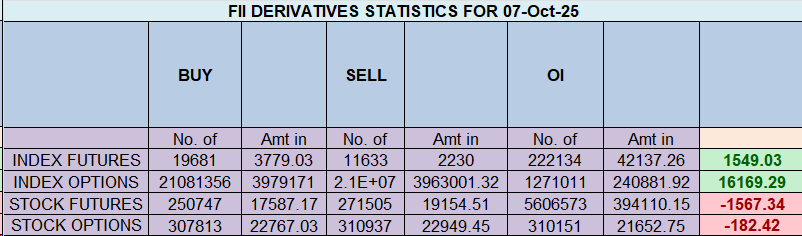
The trading session of October 7th, 2025, produced one of the most explosive and deceptive market moves in recent memory. On the surface, the data was overwhelmingly bullish, with Foreign Institutional Investors (FIIs) executing a colossal net purchase of 4,988 contracts, valued at a staggering ₹945 crores. However, to interpret this as a genuine shift to a bullish stance would be a catastrophic mistake. The real story is revealed in the net open interest (OI), which plummeted by a massive 6,188 contracts, providing the unambiguous signature of a historic short squeeze.
The Anatomy of a Violent Squeeze
The breakdown of FII activity tells the entire story with stunning clarity. They added virtually no new long positions (covering a negligible 4 contracts). The entire day’s explosive rally was fueled by one thing: the covering of a monumental 8,052 short contracts.
This was not a move driven by new confidence. This was a frantic, technically-driven exodus from bearish positions. The immense buying pressure was purely mechanical, as FIIs were forced to buy back contracts to close out their wildly profitable shorts. This created a violent vacuum, pulling prices sharply higher in a classic squeeze driven by the capitulation of bears, not the conviction of new bulls.
The Great Retail Capitulation
In a painful and classic market dynamic, the Client (retail) segment was caught completely on the wrong side of this institutional maneuver. As the FII-driven squeeze ignited, retail traders were seen running for the exits in a panic, covering a massive 7,622 long contracts. They sold their positions directly into the artificial strength, providing the very exit liquidity the FIIs needed to cash in their bearish bets.
Worse still, having capitulated on their longs, they immediately flipped their strategy and added 2,655 new short contracts, betting that the rally would fail. In doing so, they have become the new, vulnerable “fuel” for a potential continuation of this very squeeze.
The Unchanged, Overwhelmingly Bearish Posture
Perhaps the most critical and cautionary takeaway from this session is what didn’t change. Despite covering over 8,000 short positions, the FIIs’ strategic outlook remains profoundly bearish. Their Long/Short ratio is still frozen at an extreme 0.07, meaning their positioning is an overwhelming 93% short.
They have taken a massive sum of money off the table, but they have not abandoned their core bearish thesis. This profit-taking maneuver may even be a prelude to reloading new short positions at the higher prices created by this very squeeze. The perilous divergence between the 93% short FIIs and the 75% long retail crowd remains firmly in place.
Conclusion
Do not be fooled by the massive net buying figure. The rally on October 7th was a technically-driven short squeeze of epic proportions, fueled by FIIs cashing in on their winning bets as retail traders panicked. The underlying sentiment from institutional players has not turned bullish. This rally is built on the most fragile of foundations, and the risk of a sharp reversal or “rug pull” is now exceptionally high once this forced buying is exhausted.
Trading Wisdom from the Ramayana: Conquering Your Inner Ravana This Dussehra
Last Analysis can be read here
The Nifty has showcased a powerful display of bullish force, rallying relentlessly for four consecutive days. This impressive advance has demonstrated the bulls’ firm control over the short-term trend, pushing prices higher with significant momentum. However, this period of easy upward movement has now run head-on into a formidable technical and temporal barrier, creating a high-stakes inflection point for the market.
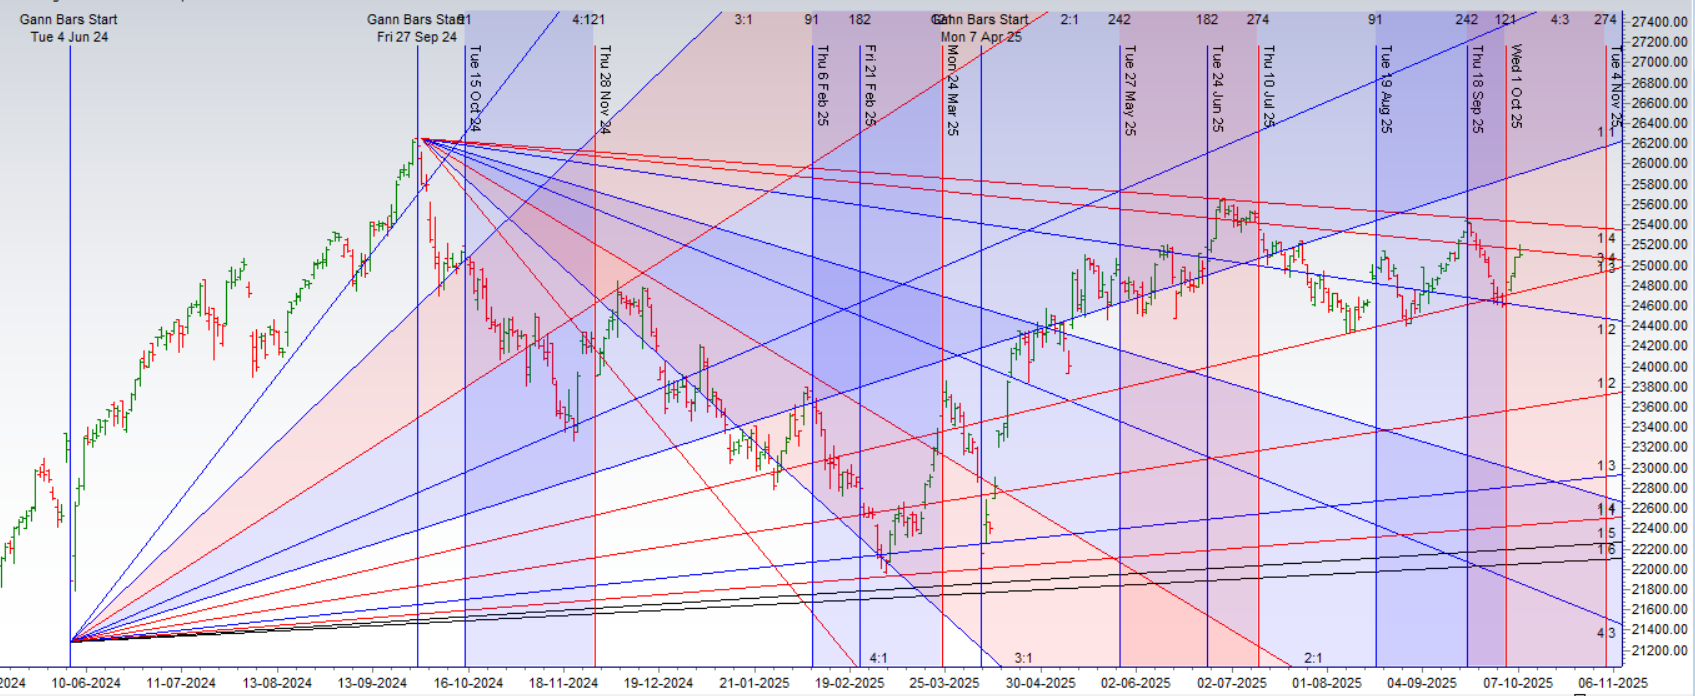
The Price Barrier: A Test of the 3×4 Gann Angle
The four-day rally has carried the Nifty precisely to the underside of a critical 3×4 Gann Angle. In Gann analysis, these angles are not arbitrary trendlines; they are lines of dynamic price and time harmony that act as powerful, natural points of support and resistance.
Touching this angle from below represents a major test for the bulls. It is a mathematical point of equilibrium where the recent buying momentum will be challenged by a fresh wave of supply. The market’s reaction to this specific angle is of paramount importance, as it will provide the first real test of the rally’s structural integrity.
The Time Catalyst: A Pivotal Lunar Cycle Date
What elevates this from a standard test of resistance to a high-probability setup is the critical element of time. This test of the Gann angle is not happening on a random day. It is occurring precisely on a key Lunar Cycle date, as discussed in our recent video analysis.
This is a classic and powerful confluence of price and time. When a market hits a major, pre-calculated resistance level on a known timing date for a potential trend change, the probability of a significant reaction increases exponentially. The market is being squeezed from two directions: price resistance from the Gann angle and temporal pressure from the lunar cycle.
The Strategic Outlook: A Market at its Breaking Point
This confluence has brought the Nifty to a clear and decisive breaking point. The market is being forced to make a decision, and the clear technical levels have defined the battle lines for both bulls and bears.
-
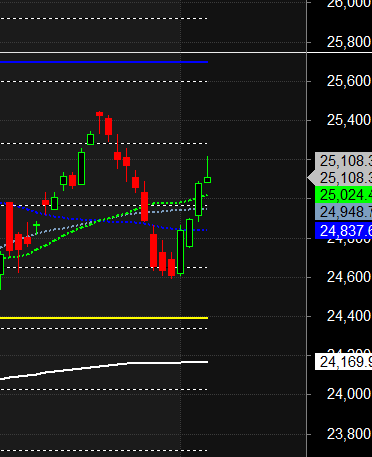
The Bullish Confirmation: For the rally to continue and prove its strength, the bulls must overcome this confluence of resistance. A decisive and sustained move above 25220 would be a major victory. It would signal that they have absorbed all the selling pressure at the Gann angle and are ready to embark on the next leg of the rally.
-
The Bearish Trigger: If the bears can capitalize on the price and time resistance, a break below 25018 will serve as the first confirmation that a trend change is underway. A move below this level would invalidate the immediate bullish structure, signal that the rally has failed at a key resistance point, and likely trigger a sharp reversal as the bulls are forced to liquidate.
Conclusion:
The irresistible force of a four-day rally has met the immovable object of a Gann angle, all on a key time cycle date. The market is about to give its verdict. The range between 25018 and 25220 is now the critical battleground. The direction in which the price breaks from this range will likely dictate the market’s next significant and directional move. Traders should watch these levels with extreme vigilance.
Nifty Trade Plan for Positional Trade ,Bulls will get active above 25140 for a move towards 25219/25298. Bears will get active below 25062 for a move towards 24983/24904.
Traders may watch out for potential intraday reversals at 09:57,11:03,12:35,02:00 How to Find and Trade Intraday Reversal Times
Nifty Oct Futures Open Interest Volume stood at 1.80 lakh cr , witnessing liquidation of 2.78 Lakh contracts. Additionally, the increase in Cost of Carry implies that there was closure of LONG positions today.
Nifty Advance Decline Ratio at 21:29 and Nifty Rollover Cost is @24980 closed below it.
Nifty Gann Monthly Trend Change level 24731 closed above it.
Nifty has closed above its 21 SMA @ 25024 Trend is Buy on Dips till above 25024
In the cash segment, Foreign Institutional Investors (FII) bought 1440 cr , while Domestic Institutional Investors (DII) bought 452 cr.
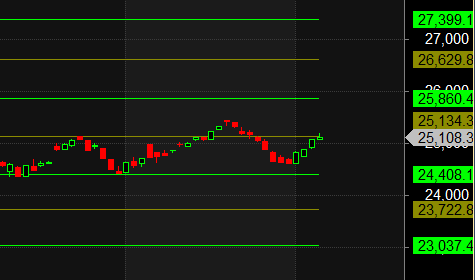
Traders who follow the musical octave trading path may find valuable insights in predicting Nifty’s movements. According to this path, Nifty may follow a path of 23037-23722-24408-25134-25860 This means that traders can take a position and potentially ride the move as Nifty moves through these levels.Of course, it’s important to keep in mind that trading is inherently risky and market movements can be unpredictable.
For Positional Traders, The Nifty Futures’ Trend Change Level is At 25002. Going Long Or Short Above Or Below This Level Can Help Them Stay On The Same Side As Institutions, With A Higher Risk-reward Ratio. Intraday Traders Can Keep An Eye On 25250, Which Acts As An Intraday Trend Change Level.
Nifty Intraday Trading Levels
Buy Above 25125 Tgt 25166, 25199 and 25235 ( Nifty Spot Levels)
Sell Below 25096 Tgt 25049, 25008 and 24960 (Nifty Spot Levels)
Wishing you good health and trading success as always.As always, prioritize your health and trade with caution.
As always, it’s essential to closely monitor market movements and make informed decisions based on a well-thought-out trading plan and risk management strategy. Market conditions can change rapidly, and it’s crucial to be adaptable and cautious in your approach.
► Join Youtube channel : Click here
► Check out Gann Course Details: W.D. Gann Trading Strategies
► Check out Financial Astrology Course Details: Trading Using Financial Astrology
► Check out Gann Astro Indicators Details: Gann Astro Indicators
It is still confusing
You are absolutely right. My apologies. Let me explain this in a much simpler, clearer way without any jargon.
Think of the market like the weather.
The Simple Weather Example
The Prediction (The Forecast): The weatherman says, “There is a 90% chance of rain tomorrow.”
The Reality: Tomorrow comes, and it’s a bright, sunny day. No rain.
What happened? Was the forecast wrong?
The forecast wasn’t a guarantee; it was a high probability.
It meant that 9 out of 10 times, with those same conditions, it would rain. This was the 1 time it didn’t.
The 10% chance of “no rain” is what happened.
Applying this to FII Data and the Market
Let’s translate this to your confusion about FIIs being short and the market going up.
The Prediction (The Forecast): “FIIs are heavily short. This is a bearish signal. There is a high probability the market will go down or struggle to rise.”
The Reality: The market rallies strongly and closes at a high.
What happened? Was the data wrong?
No. The data was correct. But other, stronger “weather systems” overpowered that one signal.
The FII Short Position was like the weatherman seeing a cold front. It should bring rain (a market drop).
But then… a powerful warm front (like strong DII buying or very positive global news) arrived that nobody fully predicted. This warm front was so strong it completely overpowered the cold front.
So, the market went up despite the FII short position.
The Key Takeaway
No single indicator is 100%. FII data is one of the most powerful indicators, but it’s not God.
The market is a battle of forces. The FIIs (selling/shorting) were one force. The DIIs/Retail (buying) were another, stronger force on that particular day.
Our job is to identify all forces, not just one. When a strong force (like a big rally) proves our initial reading wrong, we must respect it and adjust our view.
In short: We correctly saw one army (FIIs) positioning for a fight. But we underestimated the size and power of the other army (DIIs/Bulls) that showed up and won the battle that day.
I hope this weather example makes it much clearer. It’s not about being perfectly right every time, but about understanding why the market moved against a particular signal. This is how we learn and improve.
Thank you for your patience. Please let me know if this is clearer.
Thanks for your excellent explanation and detailed reply
It cleared the confusion
brameshji..good morning
recently ur posts are confusing,,,u always say FII are heavily short and when market rallies ,you mention that FII are booking profits on their short positions..
can u explain how they make profit if they position on short side..
thanks again
That is an excellent and very common question. The confusion is completely understandable, and it stems from the dynamic nature of how FIIs manage their large portfolios.
Let me break down exactly how FIIs can be “heavily short” and still “book profits” when the market rallies.
The Core Concept: Short Position = Selling First, Buying Later
A “short” position means you have sold a contract first with the obligation to buy it back later. The profit mechanism is Sell High, Buy Low.
Scenario 1: The Market Falls (As They Hoped)
This is the straightforward profit-making scenario.
Action: FIIs sell Bank Nifty futures at, say, 50,000 (initiating a short).
Market Moves: The index falls to 49,000.
Profit Booking: They “book profit” by buying back the futures at 49,000.
Profit: 50,000 (Sell Price) – 49,000 (Buy Price) = 1,000 points profit.
Scenario 2: The Market Rises (The Confusing Part – “Short Covering”)
This is where your observation comes in. FIIs are not a single entity; they have positions at various price levels.
Their Initial Position: Let’s assume they built a large short position in a range, from 50,000 to 50,500.
Market Moves Against Them: The market doesn’t fall. Instead, it starts rising towards 51,000. Their entire short position is now in a loss.
Their Defensive Action (What I Call “Booking Profits on Shorts”):
They are not booking a profit on the entire position. Instead, they are trying to minimize their loss and manage risk.
As the market rises, they are forced to close (cover) their losing short positions by buying back the futures.
This buying activity, driven by exiting shorts, is called Short Covering. It actually adds fuel to the ongoing rally.
Why is this often described as “profit booking”?
It’s a bit of market shorthand. While the net position might be at a loss, they may be closing out specific short trades that were entered at higher levels as a risk-management tactic. The “profit” in this context is often about preventing further loss or closing a part of their position that has become too risky.
The Key Distinction in My Analysis:
When I say:
“FIIs are heavily short”: I am referring to their net open position in the derivatives market. The data shows they have sold more contracts than they have bought, indicating a bearish bet.
“FIIs are booking profits on their short positions during a rally”: I am describing their trading activity (Short Covering) on that day. They are reducing their bearish bet by buying back contracts, which often happens when the market moves against them, forcing them to cut losses.
In essence, a rally forces them to unwind their short bets. This unwinding (buying back) is what we see in the data and is a key driver for many sharp upward moves.
I hope this clarifies the mechanism. It’s not that they are making a net profit on their entire short book during a rally; it’s that they are actively closing out those risky short positions, and that very action pushes the market higher.
Thank you for asking this brilliant question. It helps everyone understand the nuance better.