


A Historic Standoff: FIIs Launch an Aggressive Bearish Offensive as Retail Capitulates
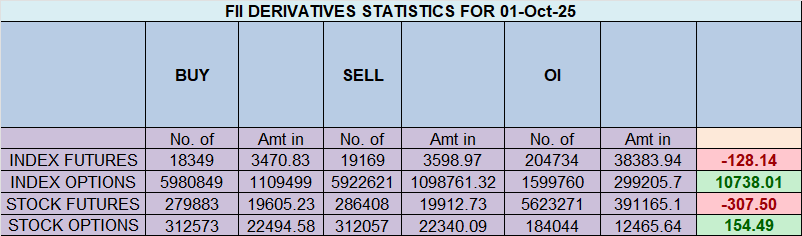
The trading session of October 1st, 2025, has etched a deep and ominous line in the sand. The data reveals a market at a breaking point, characterized by a historic and profoundly dangerous divergence between institutional and retail players. On the surface, Foreign Institutional Investors (FIIs) were massive net sellers, shorting 4,411 contracts worth a staggering ₹823 crores. However, the truly alarming signal lies in the fact that this selling was accompanied by a massive net open interest (OI) increase of 4,721 contracts.
This is not profit-taking. This is not hedging. This is the unequivocal signature of high-conviction, aggressive new short selling.
The FIIs’ All-In Bearish Bet
The FIIs are not just bearish; they are actively pressing their bets with immense force. The surge in open interest confirms that new capital is being deployed to initiate fresh short positions, signaling a strong belief that a significant downward move is imminent.
This aggressive action has pushed their positioning to a historic extreme. The FII Long/Short ratio has collapsed to a mere 0.07. This means that for every 7 long contracts, they hold 93 short contracts. Their strategic stance is now 93% short—a level of institutional pessimism that is virtually unprecedented. They are not just leaning bearish; they have thrown their entire weight behind a decline.
The Great Retail Capitulation
In a classic and painful market dynamic, the Client (retail) segment provided the perfect counterparty to the FIIs’ bearish assault. The data reveals a moment of mass capitulation from retail bears. While adding a negligible number of new longs, the standout action was the covering of a colossal 6,764 short contracts.
This is the very definition of “throwing in the towel.” Retail traders who were betting on a decline have been forced out of their positions, and in doing so, their buying-to-cover action provided the perfect liquidity for FIIs to build their massive new wall of shorts.
Worse still, the retail segment has now completely flipped, holding a dangerously optimistic Long/Short ratio of 3.16, which translates to a 76% long position.
A Market at its Breaking Point
This creates one of the most unstable and perilous market structures imaginable. We have a historic standoff:
-
FIIs (Smart Money): At a record 93% short, actively adding to their positions.
-
Clients (The Crowd): At a highly optimistic 76% long, having just capitulated on their shorts.
This is an unsustainable imbalance. The massive and vulnerable pool of retail long positions now represents the “fuel” for the very fire the FIIs are positioned for. Any breach of key technical support could trigger a cascade of stop-losses and forced selling from these retail accounts, leading to a swift and severe decline.
Conclusion:
The data from October 1st is one of the most powerful bearish signals one can receive. FIIs have launched an aggressive bearish offensive, and retail traders have not only absorbed their selling but have also positioned themselves on the wrong side of the institutional tide. The risk is now overwhelmingly skewed to the downside. Any minor bounce should be viewed with extreme suspicion, as the market is now in a structurally precarious and dangerous position.
Trading Wisdom from the Ramayana: Conquering Your Inner Ravana This Dussehra
Last Analysis can be read here
The Nifty’s sharp rebound today was not a random event or a mere reaction to oversold conditions. It was a textbook technical reversal, precisely anticipated and executed according to the principles of W.D. Gann’s time and price analysis. After a period of relentless selling, the market found its footing at a powerful confluence of support, setting the stage for a critical and high-stakes battle as we head into the weekly close.
The Time Signal: A Perfect “9-Day Fall” Reversal
The foundation for today’s recovery was laid by a classic Gann time cycle rule, which astute traders have been tracking closely. The rule states:
If a price is falling for 9 consecutive days at a stretch, then there is a high probability of a pullback for at least 5 consecutive days (a 9:5 ratio).
The market fulfilled the conditions for this rule perfectly, completing its ninth day of decline and making a reversal highly probable. Today’s strong bounce was the anticipated reaction, a powerful demonstration of how time cycles can govern market rhythm and pinpoint key turning points. This was not a guess; it was a high-probability setup that has now played out as expected.
The Price Confirmation: The Gann Angle Provides a Perfect Floor
Adding a powerful layer of price-based confirmation to this time-based signal, the Nifty found support precisely at a key Gann Angle. As shown in our previous analyses, this dynamic angle has acted as a critical floor for the market, representing the geometric harmony of price and time.
The fact that the market’s decline halted exactly at this pre-defined technical level, on the very day that the 9-day time cycle matured, created a powerful confluence. This synergy between time and price provided the technical anchor for today’s reversal, giving traders a clear and low-risk level to trade against.
The Next Catalyst: The 1-Year Solar Date Looms
Just as the market begins its recovery, another major temporal event is set to influence the proceedings. Today marks the 1-year anniversary of a significant Solar Eclipse. In cycle analysis, anniversaries of major celestial events often act as powerful echoes, triggering volatility, trend changes, or a test of the market’s resolve.
The impact of this anniversary date will be felt directly in tomorrow’s session. With the market already at a critical inflection point, this adds another layer of significance to what is already a crucial weekly closing session.
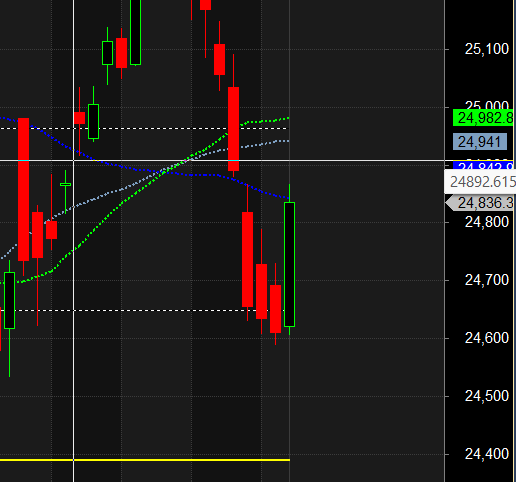
The Weekly Battleground: The 24926 – 24950 Range
This confluence of events has established a clear and decisive battleground for the weekly close. The range between 24926 and 24950 is now the ultimate arbiter of this week’s trend. Both bulls and bears will fight relentlessly to control the closing print relative to this zone.
-
The Bulls’ Objective: A weekly close above 24950 would be a major victory. It would validate today’s reversal, confirm the power of the Gann support, and set a positive tone for the start of next week, suggesting the 5-day pullback has more room to run.
-
The Bears’ Objective: A close below 24926 would be a significant bearish statement. It would frame today’s bounce as a mere temporary, technically-driven “head fake” and signal that the bears remain in firm control of the overarching trend.
Conclusion:
The market has given us a perfect reversal based on the harmony of time and price. Now, as we head into a major cycle date and a critical weekly close, the battle lines are drawn. The price action around the 24926-24950 zone will be the final word on whether today’s powerful bounce is the start of a sustainable recovery or just a brief respite in a larger downtrend. Stay vigilant.

Nifty Trade Plan for Positional Trade ,Bulls will get active above 24873 for a move towards 24951/25029. Bears will get active below 24795 for a move towards 24717/24639.
Traders may watch out for potential intraday reversals at 09:35,10:59,12:26,02:00 How to Find and Trade Intraday Reversal Times
Nifty Oct Futures Open Interest Volume stood at 1.72 lakh cr , witnessing addition of 1.5 Lakh contracts. Additionally, the increase in Cost of Carry implies that there was addition of LONG positions today.
Nifty Advance Decline Ratio at 39:11 and Nifty Rollover Cost is @24980 closed below it.
Nifty Gann Monthly Trend Change level 24731 closed above it.
Nifty has closed above its 50 SMA @ 24830 Trend is Buy on Dips till above 24800
Market in Turmoil: Retail Rushes for Puts as FIIs Quietly Position for a Bounce
Following a significant market decline, today’s options data reveals a market in a state of turmoil and transition. The entire landscape has been reset, with the Max Pain level plummeting to 24800. This acts as a powerful new anchor, suggesting that option writers now see this lower level as the most probable expiry point. The Put-Call Ratio (PCR) at a neutral 1.02 indicates a state of near-perfect equilibrium between bullish and bearish bets, but this balance masks a chaotic and frantic repositioning beneath the surface, highlighting a classic divergence between panicked retail and opportunistic institutions.
The Retail Position: A Flurry of Fear and Hedging
The retail segment’s activity is a textbook example of a reaction to a sharp fall. Their dominant action was in the Put options, where they traded nearly one million contracts on both the long and short sides. While the net position is only slightly long, the sheer volume signifies a massive wave of hedging and panic. Traders were rushing to buy Puts for protection while simultaneously selling other Puts, likely to finance those purchases, creating immense churn.
Simultaneously, they were significant net sellers of Call options. This is a clear signal of capitulation on the upside. Retail traders are no longer betting on a rally; they are actively selling the upside potential to collect premium, believing that any bounce will be short-lived. This dual action—frantic Put activity and aggressive Call writing—paints a picture of a fearful and bearishly positioned retail crowd.
The FII Strategy: Calm Opportunism Amidst the Chaos
In stark contrast, the Foreign Institutional Investors (FIIs) have responded with calculated and opportunistic precision. While retail was selling Calls, the FIIs were net buyers of Call options. This is a subtle but profoundly important contrarian signal. The “smart money” is using the spike in fear (and resulting drop in Call premiums) as an opportunity to purchase cheap, out-of-the-money Calls, positioning themselves for a potential sharp bounce or relief rally.
Their activity in the Put options was also highly strategic. They were nearly balanced but ended as slight net buyers, indicating professional hedging rather than outright panic. They are protecting their portfolios but are not contributing to the frantic selling pressure. The key takeaway from the FIIs is their calm demeanor and their quiet, contrarian bet on a potential upside surprise.
Option Chain Support and Resistance
This activity has carved out a new battlefield on the option chain:
-
Resistance: The heavy Call writing by the retail segment has built a formidable new wall of supply. The highest concentration of Call open interest is now located at 24900 and, more significantly, at the psychological 25000 strike, which now acts as a major ceiling.
-
Support: The Max Pain level at 24800 forms the new primary support base for the market. The massive volume of Puts traded around this area solidifies it as the key level that option sellers will defend. The next significant support is at 24700.
Conclusion
The market has undergone a significant bearish reset. Retail traders have panicked, aggressively hedged, and given up on the upside. The FIIs, however, are doing the opposite. They are calmly hedging while opportunistically buying Calls, positioning themselves to profit from the very bounce that retail has sold away. The stage is now set for a potential short-term relief rally, as the panic may be reaching a point of exhaustion.
In the cash segment, Foreign Institutional Investors (FII) sold 1605 cr , while Domestic Institutional Investors (DII) bought 2916 cr.
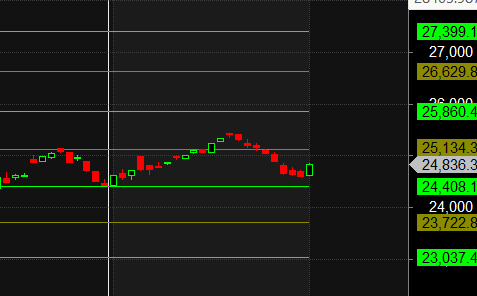
Traders who follow the musical octave trading path may find valuable insights in predicting Nifty’s movements. According to this path, Nifty may follow a path of 23037-23722-24408-25134-25860 This means that traders can take a position and potentially ride the move as Nifty moves through these levels.Of course, it’s important to keep in mind that trading is inherently risky and market movements can be unpredictable.
For Positional Traders, The Nifty Futures’ Trend Change Level is At 24850. Going Long Or Short Above Or Below This Level Can Help Them Stay On The Same Side As Institutions, With A Higher Risk-reward Ratio. Intraday Traders Can Keep An Eye On 24882 , Which Acts As An Intraday Trend Change Level.
Nifty Intraday Trading Levels
Buy Above 24850 Tgt 24888, 24930 and 24975 ( Nifty Spot Levels)
Sell Below 24795 Tgt 24743, 24715 and 24666 (Nifty Spot Levels)
Wishing you good health and trading success as always.As always, prioritize your health and trade with caution.
As always, it’s essential to closely monitor market movements and make informed decisions based on a well-thought-out trading plan and risk management strategy. Market conditions can change rapidly, and it’s crucial to be adaptable and cautious in your approach.
► Join Youtube channel : Click here
► Check out Gann Course Details: W.D. Gann Trading Strategies
► Check out Financial Astrology Course Details: Trading Using Financial Astrology
► Check out Gann Astro Indicators Details: Gann Astro Indicators