


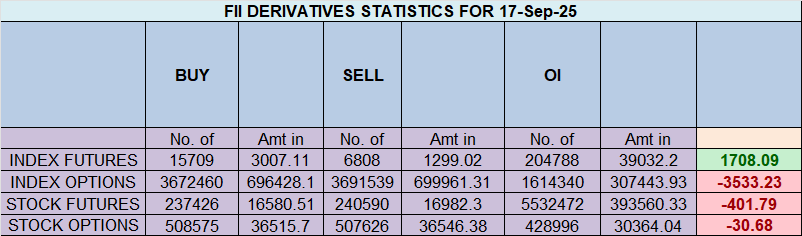
FII & Client Index Futures Activity – 18 Sep 2025
Foreign Institutional Investors (FIIs) maintained a bullish stance in the Nifty Index Futures market by buying 4,391 contracts worth ₹838 crore. However, this move resulted in a net open interest (OI) decrease of 2,115 contracts, reflecting more of a short-covering bias.
Breaking Down FII Activity
-
✔ Added 749 long contracts
-
✔ Covered 6,252 short contracts
Client Behaviour
-
✔ Covered 5,832 long contracts
-
✔ Covered 1,943 short contracts
Current Positioning in Index Futures
-
FIIs: Long–Short = 14:86, Ratio = 0.16 (still heavily short despite short-covering)
-
Clients: Long–Short = 70:30, Ratio = 2.35 (holding a bullish bias)
✅ This shows FIIs are reducing shorts aggressively, but still remain net short-heavy, while clients are building a stronger bullish stance.
Why Trading is So Hard: The Unseen Psychological Battle for Success
Last Analysis can be read here
The Nifty index provided a textbook example of a “buy the rumor, sell on news” scenario today. The initial gap-up, fueled by the widely expected 25 basis point rate cut from the US Federal Reserve, was met with a swift and decisive wave of selling. This reversal indicates that the positive news was already fully priced into the market, and its confirmation became a catalyst for profit-taking rather than further advancement.
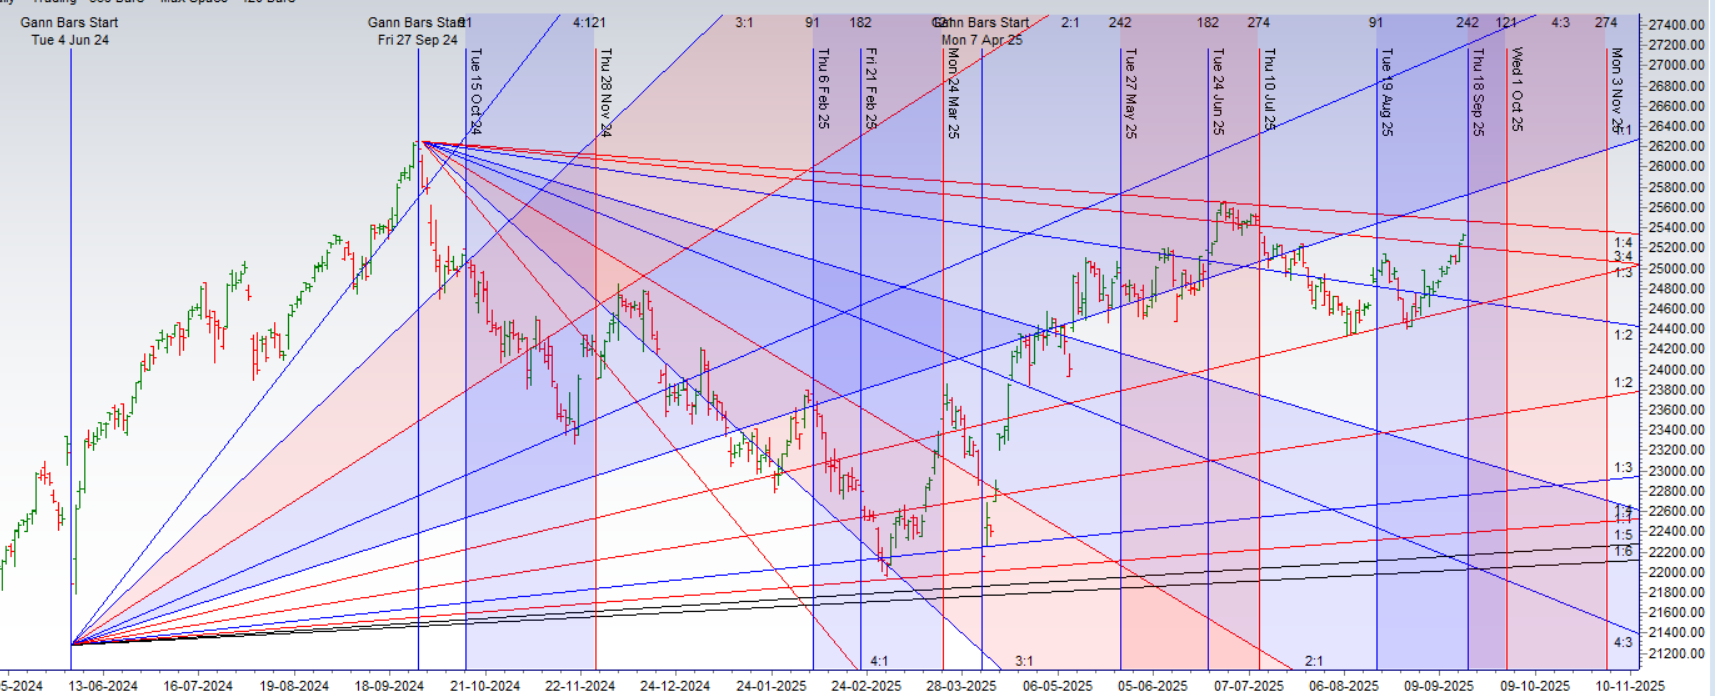
What elevates this from a routine profit-taking event to a high-stakes setup is a rare and potent confluence of timing models. The market is currently under the influence of two major planetary shifts in quick succession: today’s Mercury Ingress is immediately followed by a Venus Ingress tomorrow. A scenario where two short-term planets change signs within a 24-hour period is a significant astrological event, which the legendary W.D. Gann himself termed a “double ingress.” Such alignments are known to disrupt established trends and act as powerful catalysts for new, high-velocity price swings.
To amplify this further, this powerful astrological window aligns perfectly with a pre-calculated Gann time cycle date. When two independent and historically reliable timing methodologies—astrology and Gann cycles—converge, the probability of a significant directional move increases dramatically. The market is not just pausing; it is winding up at a critical temporal pivot point.
For traders, the technical battle lines are now drawn with precision against this volatile backdrop:
-
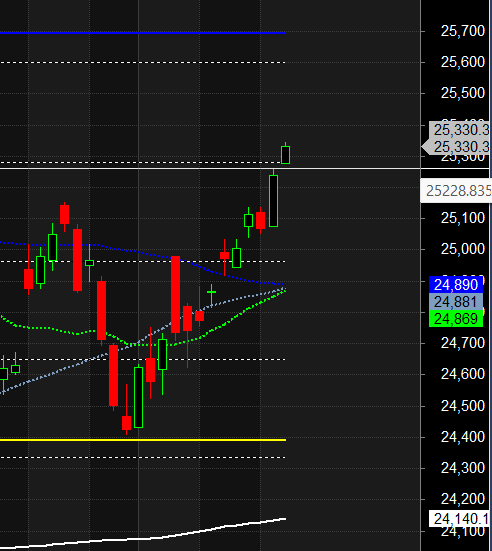
The key “line in the sand” for the bulls is the 25230 support level. As long as the Nifty can hold above this crucial base, the underlying bullish structure remains intact, and a continuation of the advance towards the upper targets of 25426 / 25555 remains a possibility.
-
However, a failure to hold 25300 amidst this powerful confluence of timing cycles would signal that the “sell on news” reversal has more momentum, likely leading to a deeper correction.
Given the high potential for an expansion in volatility, the intraday strategy for tomorrow is clear and precise: the high and low of the first 15 minutes of trading will serve as the definitive guide. A break of this opening range will likely dictate the trend for the remainder of the session and provide the first clue as to how the market is resolving the immense energy from this “double ingress.”
Nifty Trade Plan for Positional Trade ,Bulls will get active above 25350 for a move towards 25467/25549. Bears will get active below 25230 for a move towards25151/25072
Traders may watch out for potential intraday reversals at 09:47,10:39,12:44,02:25 How to Find and Trade Intraday Reversal Times
Nifty Sep Futures Open Interest Volume stood at 1.55 lakh cr , witnessing liquidation of 1.7 Lakh contracts. Additionally, the increase in Cost of Carry implies that there was closeure of SHORT positions today.
Nifty Advance Decline Ratio at 36:14 and Nifty Rollover Cost is @24980 closed above it.
Nifty Gann Monthly Trend Change level 24678 closed above it.
Nifty has closed above its 50 SMA @ 24900 Trend is Buy on Dips till above 25200
A Market Coiled for a Breakout: FIIs Bet on Volatility While Retail Sells Stability
The options market is currently painting a picture of intense and unsustainable equilibrium, with a profound strategic divergence between retail traders and Foreign Institutional Investors (FIIs). The market’s current fulcrum is the Max Pain level at 25350, the point of least profitability for option buyers, which often acts as a magnet for the price. The Put-Call Ratio (PCR) of 1.09 suggests a slight underlying caution, with more Put options being traded than Calls, indicating that hedging activity is a significant theme.
The Retail Strategy: A High-Conviction Bet on a Quiet Market
Retail traders have positioned themselves with a clear and unified strategy: they are betting decisively against a large market move. Their activity shows they were net sellers of both Call and Put options. By being net short in Calls, they are betting that the upside is capped and that the Nifty will struggle to break through immediate resistance. By simultaneously being significant net sellers of Puts, they are expressing strong confidence that the downside is protected and the market will not experience a significant fall.
This dual strategy of writing both Calls and Puts is a classic “short strangle” approach. Retail is acting as the “insurance seller,” collecting premium from both sides with the high-conviction belief that the market will remain range-bound and that volatility will decrease.
The FII Strategy: A Professional Bet on a Major Move
In a direct and telling contradiction, the FIIs have positioned themselves for the exact opposite outcome. Their activity shows they were net buyers of both Call and Put options. By being net long in Calls, they are placing a leveraged bet that the market could break out to the upside. Simultaneously, by being significant net buyers of Puts, they are positioning for a potential decline or, more likely, purchasing insurance against a sharp fall.
This strategy of buying both Calls and Puts is a professional “long strangle” or volatility play. The FIIs are not necessarily certain of the direction, but they are positioning with high conviction that the current state of calm is about to end and a significant, high-velocity move is imminent. They are the “insurance buyers,” willing to pay the premium that retail is collecting, because they anticipate a breakout that will make one side of their trade extremely profitable.
Option Chain Support and Resistance
This strategic battle carves out clear levels on the option chain:
-
Resistance: The heavy Call writing from the retail segment has built a formidable wall of supply. The highest concentration of Call open interest is now fortified at the 25400 and 25500 strikes, representing the primary resistance zone.
-
Support: The aggressive Put writing from retail has created a strong support base. The highest concentration of Put open interest is located at the 25300 and 25200 strikes, forming a solid floor.
Conclusion
A classic and unsustainable standoff is underway. Retail is betting on stability and collecting premium, effectively selling insurance. The FIIs are betting on a major breakout and are actively buying that insurance. The Max Pain at 25350 is the point of maximum tension between these two opposing forces. This is a market coiling like a spring. The current equilibrium cannot last, and a significant expansion in volatility is imminent, which will prove one side right and the other spectacularly wrong.
In the cash segment, Foreign Institutional Investors (FII) bought 366 cr , while Domestic Institutional Investors (DII) bought 3326 cr.
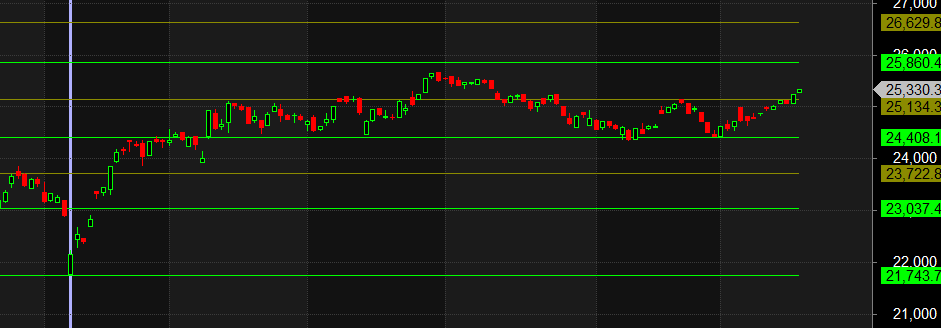
Traders who follow the musical octave trading path may find valuable insights in predicting Nifty’s movements. According to this path, Nifty may follow a path of 23037-23722-24408-25134-25860 This means that traders can take a position and potentially ride the move as Nifty moves through these levels.Of course, it’s important to keep in mind that trading is inherently risky and market movements can be unpredictable.
For Positional Traders, The Nifty Futures’ Trend Change Level is At 24993. Going Long Or Short Above Or Below This Level Can Help Them Stay On The Same Side As Institutions, With A Higher Risk-reward Ratio. Intraday Traders Can Keep An Eye On 25487 , Which Acts As An Intraday Trend Change Level.
Nifty Intraday Trading Levels
Buy Above 25338 Tgt 25385, 25430 and 25484 ( Nifty Spot Levels)
Sell Below 25288 Tgt 25246, 25220 and 25166 (Nifty Spot Levels)
Wishing you good health and trading success as always.As always, prioritize your health and trade with caution.
As always, it’s essential to closely monitor market movements and make informed decisions based on a well-thought-out trading plan and risk management strategy. Market conditions can change rapidly, and it’s crucial to be adaptable and cautious in your approach.
► Join Youtube channel : Click here
► Check out Gann Course Details: W.D. Gann Trading Strategies
► Check out Financial Astrology Course Details: Trading Using Financial Astrology
► Check out Gann Astro Indicators Details: Gann Astro Indicators