


Market Analysis: FIIs Signal Retreat from Bearish Bets, Triggering Short Covering in Bank Nifty
The derivatives data from August 19th reveals a significant shift in strategy from Foreign Institutional Investors (FIIs) in the Bank Nifty. Their net buying of index futures, coupled with a sharp decrease in Open Interest, indicates a move to cover existing short positions rather than build new bullish ones. This activity suggests that FIIs are reducing their bearish exposure, likely triggered by a market up-move, which provided a clear signal that downside momentum was fading.
This unwinding of bearish bets served as a key technical catalyst, forcing those who were short to buy back contracts to limit losses, thereby fueling a rally in the index.
1. Decoding the FII Action: A Tactical Retreat
The FII activity was a clear example of short covering, a defensive but powerful market maneuver.
-
Buying to Cover: FIIs were net buyers in Bank Nifty index futures to the tune of ₹103 crore, this buying occurred as the Bank Nifty rose by 0.71% This pattern—buying into strength—is characteristic of traders exiting losing short positions. It reflects a forced capitulation rather than a confident initiation of new long positions.
-
Not a Bullish Conviction: The primary driver appears to be risk management. Instead of seeing this as FIIs becoming aggressively bullish, it should be interpreted as them acknowledging that their previous bearish bets were no longer tenable in the face of a rising market. This action removes immediate selling pressure and can temporarily support prices.
2. The Critical Confirmation: Plummeting Open Interest (OI)
The most compelling evidence for this short-covering thesis is the significant drop in Open Interest.
-
OI Decreased Sharply: Bank Nifty Futures Open Interest fell by a substantial 4.20%. This indicates that a large number of outstanding contracts were closed out.
-
The Classic Short Covering Formula: The combination of a rising price and falling Open Interest is a textbook signal of short covering.It confirms that the net buying activity was primarily aimed at exiting existing short positions. New money was not entering the market to build fresh long positions; instead, old bearish bets were being neutralized. This reduction in outstanding shorts makes the market lighter and less susceptible to sudden downward pressure.
3. Strategic Implications and Market Outlook
This shift in FII positioning has several important implications for the Bank Nifty’s near-term trajectory.
-
Reduced Downside Pressure: With a significant number of shorts now out of the system, the persistent selling pressure that may have capped previous rallies has eased. This creates a more favorable environment for bulls.
-
Potential for Further Upside: Short covering rallies can be powerful. As prices rise, more shorts are forced to cover, creating a feedback loop that can propel the index higher. The immediate path of least resistance has shifted to the upside.
Conclusion:
The FII data from August 19th paints a clear picture of a bearish retreat. The aggressive short covering, confirmed by the potent combination of rising prices and falling Open Interest, marks a significant technical shift for the Bank Nifty. While this does not necessarily signal the start of a long-term bull run initiated by “smart money,” it does confirm that the immediate bearish pressure has lifted. This creates a supportive environment for the index, suggesting that the recent lows are likely to hold and that further upside is possible in the near term as the market is no longer weighed down by a heavy build-up of institutional short positions.
Bank Nifty August Futures Open Interest Volume stood at 25.6 lakh, with liqudiation of 1.01 Lakh contracts. Additionally, the Increase in Cost of Carry implies that there was a covering of SHORT positions today.
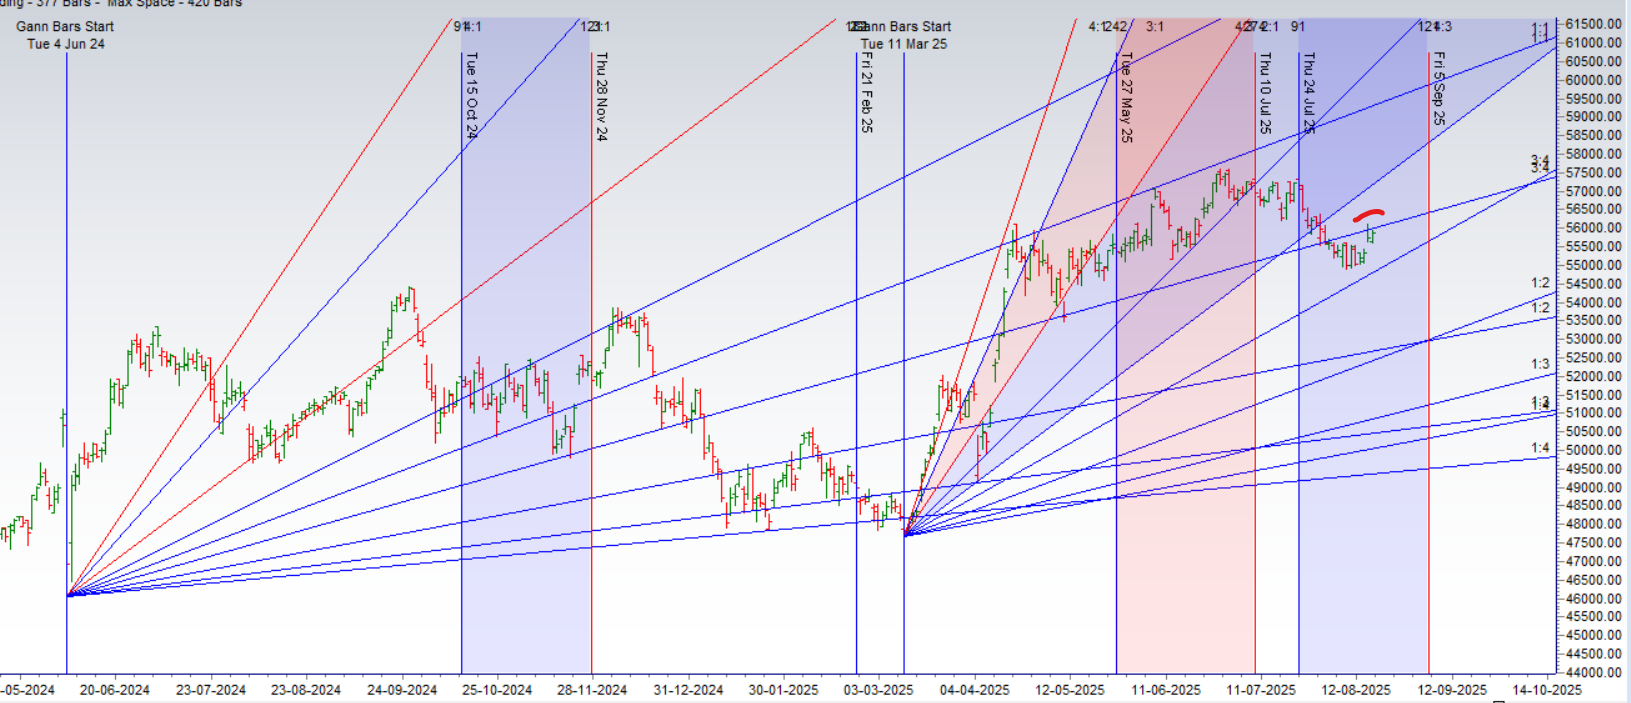
Bank Nifty Advance Decline Ratio at 09:03 and Bank Nifty Rollover Cost is @56344 closed below it.
BANK Nifty Gann Monthly Buy Level : 56242
BANK Nifty Gann Monthly Sell Level : 55555
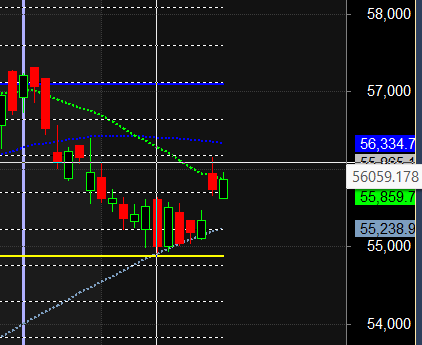
Bank Nifty closed above its 21SMA @55859 ,Trend is Sell on Rise till below 56330
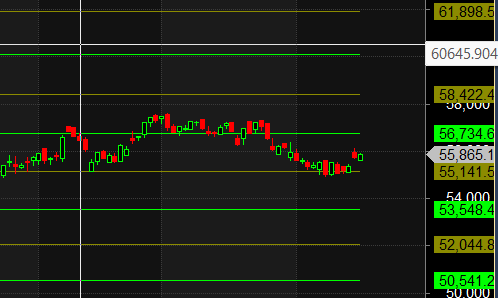
Traders who follow the musical octave trading path may find valuable insights in predicting Bank Nifty’s movements. According to this path, Bank Nifty may follow a path of 53548-55141-56734-58422. This means that traders can take a position and potentially ride the move as Bank Nifty moves through these levels. Of course, it’s important to keep in mind that trading is inherently risky and market movements can be unpredictable.
According to the Bank Nifty options chain, the call side has the highest open interest (OI) at the 56000 strike, followed by the 56500 strike. On the put side, the 55500 strike has the highest OI, followed by the 55000 strike.This indicates that market participants anticipate Bank Nifty to stay within the 55500-56500 range.
The Bank Nifty options chain shows that the maximum pain point is at 56000 and the put-call ratio (PCR) is at 0.77 Typically, when the PCR open interest ranges between 0.90 and 1.05, the market tends to remain range-bound. PCR is on extreme end suggesting we can see sharp reversal .
Doubling down does not work for the intraday trader. I have tried it. Eighty-five percent of the time you will profit when you double down. But the 15 percent of the time you are wrong, you will get smoked. The losses during these trades will far outweigh the gains from the 85%
For Positional Traders, The Bank Nifty Futures’ Trend Change Level is At 55668. Going Long Or Short Above Or Below This Level Can Help Them Stay On The Same Side As Institutions, With A Higher Risk-reward Ratio. Intraday Traders Can Keep An Eye On 55865 , Which Acts As An Intraday Trend Change Level.
BANK Nifty Intraday Trading Levels
Buy Above 55840 Tgt 56000, 56170 and 56375 (BANK Nifty Spot Levels)
Sell Below 55729 Tgt 55610, 55455 and 55300 (BANK Nifty Spot Levels)
Wishing you good health and trading success as always.As always, prioritize your health and trade with caution.
As always, it’s essential to closely monitor market movements and make informed decisions based on a well-thought-out trading plan and risk management strategy. Market conditions can change rapidly, and it’s crucial to be adaptable and cautious in your approach.
► Join Youtube channel : Click here
► Check out Gann Course Details: W.D. Gann Trading Strategies
► Check out Financial Astrology Course Details: Trading Using Financial Astrology
► Check out Gann Astro Indicators Details: Gann Astro Indicators