


Market Analysis: Bears Blink First as Massive FII Short Covering Signals a Potential Market Bottom
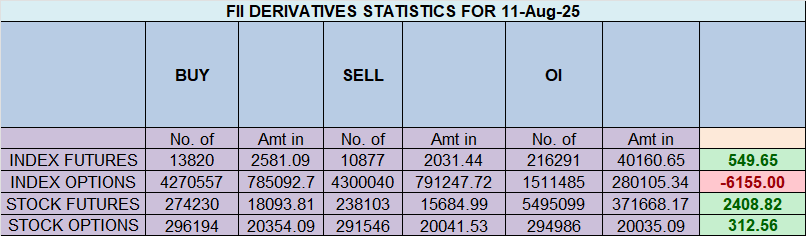
The derivatives data from August 11th reveals a critical and dramatic shift in institutional behavior that strongly suggests a potential market bottom is forming. While FIIs remain overwhelmingly bearish in their overall positioning (08:92 ratio), their activity on this day tells a story of capitulation and de-risking. The headline “buying” was not due to new bullish conviction but was driven by a massive short-covering rally. This action, combined with a significant drop in Open Interest, signals that the bearish trend is exhausted and the market is now primed for a sharp, short-squeeze-driven rally.
1. Decoding the FII Activity: It’s All About the Short Covering
This is the most crucial takeaway from the data. The FIIs’ net positive figure was not because they turned bullish; it was because they started to abandon their bearish bets.
-
Massive Short Covering: FIIs covered a substantial 2,783 short contracts. This is a significant move that indicates bears are either taking profits on their successful shorts or are growing fearful of an impending rally and are rushing to close their positions to avoid losses.
-
Negligible New Longs: They added a paltry 160 new long contracts. This proves that there is no fresh bullish conviction yet. The entire positive net figure is a result of de-risking from the short side.
Interpretation: This is the first crack in the bearish armor. After building a massive short position, the “smart money” is now showing the first signs of fear. This is often the very first signal of a market bottom. They are not buying because they are optimistic; they are buying back their shorts because they are scared of losing money if the market reverses.
2. Client Behavior: Profit-Taking by the Bulls
The retail client segment, which has been stubbornly bullish, also showed signs of de-risking.
-
Longs Taking Profits: Clients covered 1,952 long contracts. This suggests that on a small market bounce, the retail bulls who have been holding on are now using the opportunity to exit their positions, likely happy to get out at a better price after a period of decline.
This is a classic feature of a market bottom: the weak-hand bulls capitulate and sell their positions to the short-covering bears.
3. The Definitive Clue: A Sharp Drop in Open Interest (OI)
The decrease in Open Interest by 2,417 contracts confirms the narrative of trend exhaustion.
-
What it means: A drop in OI signifies that more positions were closed than were opened. It is a sign of de-risking from all parties.
-
The Bottoming Formula: In this specific context, the OI fell because FIIs were closing their shorts and Clients were closing their longs. This indicates that both sides are reducing their exposure and the prevailing trend is losing its fuel. A sharp fall in OI after a sustained downtrend is one of the most reliable signals that the trend is ending.
4. The Big Picture: Positioning vs. Flow
It is critical to distinguish between the current positioning and the daily flow.
-
Positioning is Still Bearish: The FII long-to-short ratio is still at an extremely bearish 08:92. This means they are still holding a massive number of short positions.
-
Flow has Turned Bullish (via Short Covering): However, the flow of money on this day was bullish.
This is the classic setup for a short-squeeze rally. With FIIs still holding an enormous number of short positions, any sustained upward move will force them to cover even more of their shorts, creating a self-fueling upward spiral. Today’s short covering was just the first domino to fall.
Conclusion:
Despite the headline positioning ratio still appearing extremely bearish, the activity on August 11th is a powerful bullish reversal signal. The combination of massive FII short covering and a significant drop in Open Interest strongly indicates that the bearish trend has lost its momentum and a market bottom is being formed. The potential for a violent short-squeeze rally in the coming days is now exceptionally high. The bears have blinked first, and the bulls are about to get a major tailwind from their capitulation.
The Green Light Effect: Why Markets Rally When Planets Go Direct
Last Analysis can be read here
The market has perfectly followed the bullish script discussed previously, with the Nifty rallying strongly as the impactful Mercury Direct station took effect. Now, the bulls face their next critical test: achieving the first “higher high” after a seven-session downtrend. This pivotal moment coincides with the formidable resistance of a 3×4 Gann angle, pinpointed by the key level of 24649. The bullish case is powerfully supported by a highly optimistic Venus-Jupiter aspect, which puts banks in the spotlight, and a favorable global tailwind from the US pausing China tariffs. However, a significant India-specific headwind remains in the form of US tariff friction, making the battle for 24649 the central theme of the day.
The Bullish Momentum Confirmed: The Next Technical Hurdle
The recent rally has successfully reversed the short-term negative sentiment. The market’s immediate objective is now to break the bearish structure of the past week.
-
The “Higher High” Mission: For the past seven sessions, the market has been making lower highs, a classic sign of a downtrend. A sustained move above the previous high today would be the first definitive technical signal that the trend has reversed from down to up.
-
The 24649 Gann Wall: This critical “higher high” level is reinforced by a 3×4 Gann angle and the specific Gann number of 24649. This is not just a minor resistance; it is a significant technical barrier. A decisive close above this level is required to confirm that the bulls have taken full control and are ready to target higher levels.
2. The Twin Engines of the Rally: Astro and Geopolitics
The bullish case is being fueled by two powerful catalysts today.
-
Astro Fuel (Venus Conjunct Jupiter): Today’s session is supercharged by one of the most benevolent astrological aspects for financial markets. The conjunction of Venus (planet of money, assets, and harmony) with Jupiter (planet of expansion, luck, and big money) creates a wave of powerful optimism. This is a classic “risk-on” signal that encourages buying and boosts confidence.
-
Keep an Eye on Banks: This aspect is particularly potent for the financial sector. Bank Nifty is likely to be a key leader in today’s session, and strong performance from banking stocks could provide the necessary thrust to push the Nifty through its resistance.
-
-
Global Tailwind (China Tariff Pause): The news that the US has paused tariffs on China for 90 days provides a significant boost to global risk sentiment. It removes a major source of uncertainty and encourages capital to flow back into emerging markets. This creates a favorable backdrop for the bulls.
3. The India-Specific Headwind: An “Ego” Play
However, the bullish sentiment is not without a significant and specific hurdle for the Indian market.
-
The Tariff Disparity: The fact that China, a major buyer of Russian oil, is getting a tariff reprieve while India is still facing a 25% tariff threat highlights a point of friction in US-India trade relations. As noted, this appears to be an “EGO at play” between the two nations.
-
Market Impact: This situation creates a specific headwind for Indian equities. It could cap the Nifty’s rally, cause it to underperform other emerging markets, and give bears a concrete reason to defend the 24649 level aggressively. This makes the technical battle at this level even more critical.
Conclusion:
The stage is set for a classic confrontation. The bulls, armed with powerful astrological support and positive global news, are attempting to break a key technical barrier at 24649 to confirm a new uptrend. The bears, however, are using the specific negative news on the India-US tariff front to defend this crucial level.
The outcome of the day will be decided by which force is stronger. A decisive close above 24649 will signal a major victory for the bulls and open the doors for a much higher move. A rejection from this level would suggest the India-specific headwinds are too strong to overcome, and the market could be in for another round of consolidation or weakness.
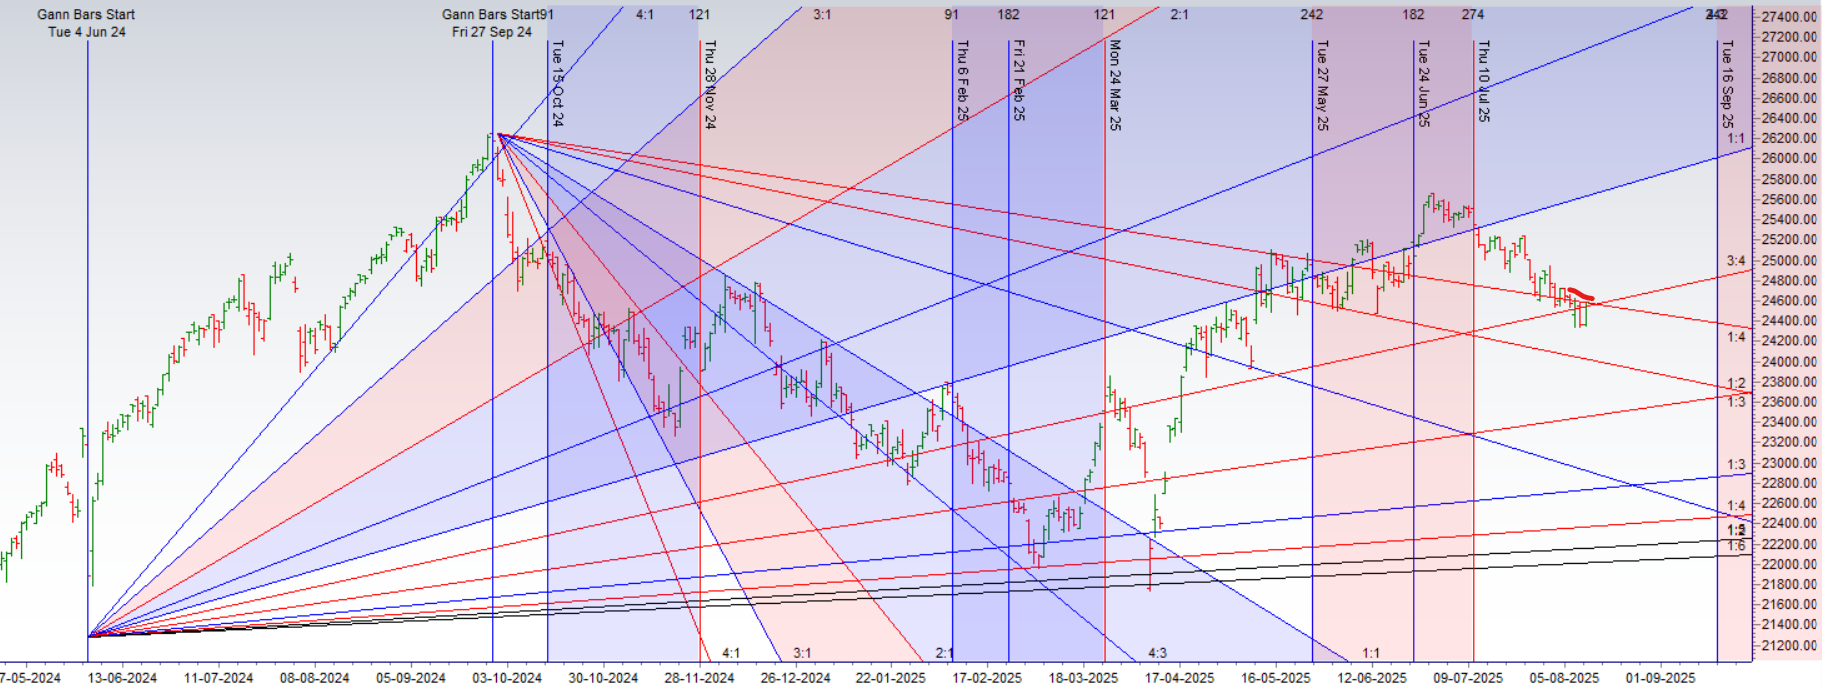
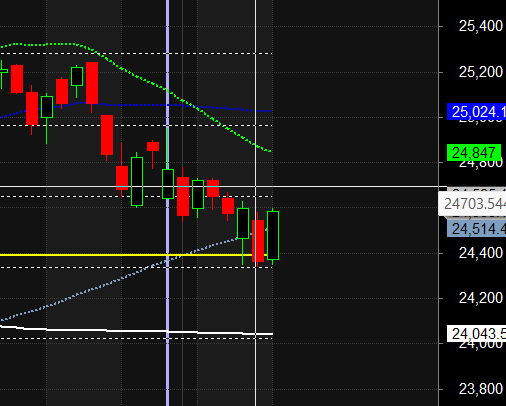
Nifty Trade Plan for Positional Trade ,Bulls will get active above 24578 for a move towards 24656/24734/24812. Bears will get active below 24500 for a move towards 24422/24344
Traders may watch out for potential intraday reversals at 09:23,10:11,11:36,02:45 How to Find and Trade Intraday Reversal Times
Nifty Aug Futures Open Interest Volume stood at 1.69 lakh cr , witnessing addition of 3.2 Lakh contracts. Additionally, the increase in Cost of Carry implies that there was closure of SHORT positions today.
Nifty Advance Decline Ratio at 46:03 and Nifty Rollover Cost is @24887 closed below it.
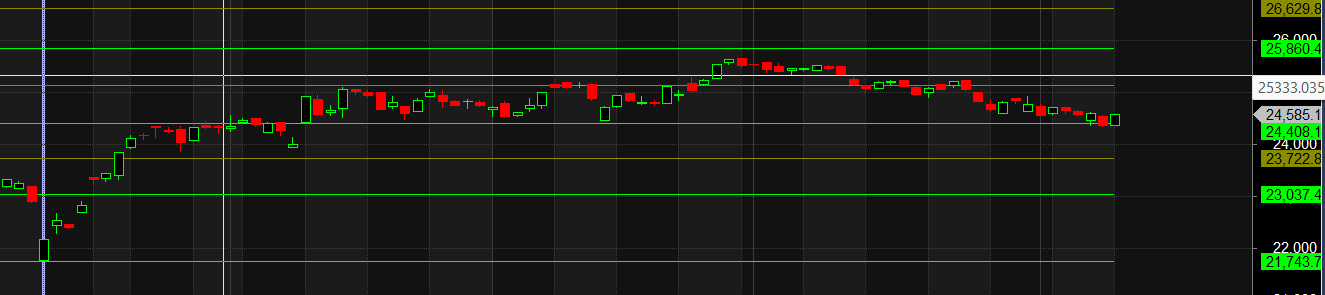
Nifty Gann Monthly Buy Level : 24887
Nifty Gann Monthly Sell Level : 24582
Nifty has closed above its 100 SMA @ 24514Trend is Buy on dips till above 24389
Nifty options chain shows that the maximum pain point is at 24600 and the put-call ratio (PCR) is at 0.99.Typically, when the PCR open interest ranges between 0.90 and 1.05, the market tends to remain range-bound.
Nifty 50 Options Chain Analysis
The Nifty 50 options chain indicates that the highest open interest (OI) on the call side is at the 24600 strike, followed by 24700 strikes. On the put side, the highest OI is at the 24500 strike, followed by 24400 strikes. This suggests that the market participants are expecting Nifty 50 to remain range between 24400-24700 levels.
Retail Panic Hits Fever Pitch as FIIs Calmly Bet Against a Crash
The latest options market data reveals a dramatic and telling chasm between retail sentiment and institutional strategy. A wave of extreme fear has gripped retail traders, who are aggressively buying protection against a market fall. In a classic contrarian move, Foreign Institutional Investors (FIIs) are calmly stepping in to take the other side of that trade, betting that the panic is overdone and a market crash is unlikely. This stark divergence has created a tense environment, strongly suggesting the market is at a major emotional turning point.
Retail’s Wave of Fearful Selling
The activity from the retail segment is a textbook picture of capitulation and panic. Their actions are overwhelmingly defensive and bearish:
-
Dumping Bullish Bets: Retail traders covered a staggering 335,000 long Call contracts. This is a massive exodus from positions that would have profited from a market rally. It signals a complete loss of faith in any potential upside as traders rush to cut their losses.
-
A Frantic Rush for Insurance: The most telling signal is the addition of 634,000 new long Put contracts. Buying puts is a direct bet on a market decline. A surge of this magnitude shows traders are desperately buying “insurance” against a fall, often at inflated prices due to high demand.
While they also sold a significant number of puts, the sheer volume of new puts bought combined with the mass exodus from calls paints a clear picture: the dominant emotion in the retail camp is fear.
FIIs: The Calm “Insurance Sellers”
In stark contrast, the “smart money” played a more calculated, bullish-to-neutral game. They positioned themselves to profit from the surge in retail fear.
-
The Key Contrarian Move: The most significant FII action was shorting 90,000 new Put contracts. By selling puts, FIIs are effectively acting as the “insurance company,” collecting the high premiums being paid by panicked retail traders. This is a confident, conditionally bullish strategy; they profit if the market stays stable or rallies, and it signals a strong belief that a major decline is improbable.
-
General De-Risking: Their activity in the Call options (covering both longs and shorts) suggests a general reduction in overall positions rather than a strong directional view. However, their primary new bet—selling puts—is a clear vote of confidence against a market collapse.
Market Outlook: A Major Contrarian Signal
This data presents a classic and powerful contrarian bullish indicator. The market has reached a state of peak retail fear. Historically, when retail panic is this palpable and is being calmly absorbed by institutional players, it often marks a significant market bottom. The fear itself becomes the fuel for a potential reversal, as a slight market uptick can trigger a cascade of covering from those who are heavily positioned for a fall.
The stage is now set for a potential short squeeze or a sharp relief rally. The smart money is not preparing for a crash; they are betting against one. For traders, this is a major red flag against being aggressively short and a strong signal to watch for signs of a bullish reversal.
In the cash segment, Foreign Institutional Investors (FII) sold 1202 cr , while Domestic Institutional Investors (DII) bought 5972 cr.
Traders who follow the musical octave trading path may find valuable insights in predicting Nifty’s movements. According to this path, Nifty may follow a path of 23037-23722-24408-25134-25860 This means that traders can take a position and potentially ride the move as Nifty moves through these levels.Of course, it’s important to keep in mind that trading is inherently risky and market movements can be unpredictable.
When you really believe that trading is simply a probability game, concepts like right or wrong or win or lose no longer have the same significance.
For Positional Traders, The Nifty Futures’ Trend Change Level is At 24667 . Going Long Or Short Above Or Below This Level Can Help Them Stay On The Same Side As Institutions, With A Higher Risk-reward Ratio. Intraday Traders Can Keep An Eye On 24548, Which Acts As An Intraday Trend Change Level.
Nifty Intraday Trading Levels
Buy Above 24610 Tgt 24648, 24680 and 24729 ( Nifty Spot Levels)
Sell Below 24555 Tgt 24512, 24470 and 24412 (Nifty Spot Levels)
Wishing you good health and trading success as always.As always, prioritize your health and trade with caution.
As always, it’s essential to closely monitor market movements and make informed decisions based on a well-thought-out trading plan and risk management strategy. Market conditions can change rapidly, and it’s crucial to be adaptable and cautious in your approach.
► Join Youtube channel : Click here
► Check out Gann Course Details: W.D. Gann Trading Strategies
► Check out Financial Astrology Course Details: Trading Using Financial Astrology
► Check out Gann Astro Indicators Details: Gann Astro Indicators