


A Bullish Mirage: Why the FIIs’ ₹223 Crore “Buy” Is a Deceptive Warning Signal
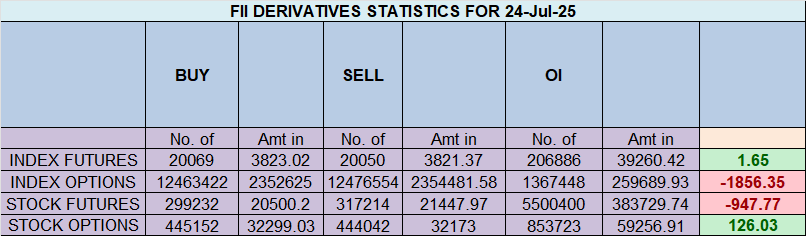
On the surface, today’s data from the Nifty Index Futures market looked like a much-needed sigh of relief for the bulls. For the first time in what feels like an eternity, Foreign Institutional Investors (FIIs) appeared to have switched sides, registering as net buyers with a significant inflow of ₹223 crore by purchasing 1,205 contracts.
Decoding the FII “Buy”: A Strategic Retreat, Not a Bullish Charge
The headline “buy” number is a product of a statistical quirk, not a change in sentiment. To understand why, we must look at the breakdown of the FIIs’ actions. Their primary activity today was not opening new positions; it was closing old ones.
-
They covered 1,516 short contracts. This is a bullish action. It means they were closing out their bearish bets, likely taking profits or reducing their exposure to a potential short squeeze.
-
They also covered 1,497 long contracts. This is a bearish action. It means they were simultaneously closing out their bullish bets, taking whatever long positions they had off the table.
The net “buy” of 1,205 contracts is simply the small difference between these two massive unwinding actions. The FIIs did not come into the market with ₹223 crore of fresh bullish conviction. Instead, they engaged in a large-scale de-risking operation, closing out positions on both sides of the market. They were reducing their overall footprint, a classic move by institutions who anticipate extreme volatility and want to step away from the line of fire.
The ultimate proof of this strategic retreat lies in the net open interest (OI) decrease of 1,277 contracts. This confirms that the dominant theme of the day was position closing. Money and conviction were leaving the market, not entering it.
The Retail Frenzy: All Gas, No Brakes
In stark, almost terrifying contrast, the Client segment (representing the retail public) saw today as a green light for a full-throttle bullish assault.
-
They added a colossal 6,156 new long contracts. This is a massive wave of fresh, aggressive buying. Retail traders are not just optimistic; they are piling into the market with a level of conviction that directly opposes the FIIs’ cautious retreat.
-
They also covered 1,107 short contracts. This “double bullish” action—aggressively adding longs while closing out shorts—shows a state of pure, unhedged optimism.
This has pushed their overall positioning to a new extreme. With a Long:Short ratio of 64:36, their positional ratio has now swelled to 2.06. This means that for every one contract they hold betting on a fall, they now hold more than two contracts betting on a rise.
The Real Story: A Market at its Most Dangerous Extreme
When we put these two pictures together, the situation becomes clear and deeply concerning.
-
The FIIs are not bullish. Despite the headline, their primary action was to reduce their overall market exposure. They are preparing for a major move by taking their chips off the table.
-
The FIIs’ underlying position remains historically bearish. Their Long:Short ratio is still a catastrophic 15:85, with a positional ratio of 0.17. They still have nearly six bets on a fall for every one bet on a rise.
-
Retail traders are now more bullish than ever. They are aggressively taking the other side of the trade, creating a massive and vulnerable pool of long positions.
This has created the most dangerously polarized market we have seen in a very long time. The “smart money” is overwhelmingly positioned for a crash but is now quietly reducing its exposure, while the “herd” is piling in, creating a massive pool of potential “weak hands.”
Master Your Mind, Master the Market: The Trader’s Guide to a Dopamine Detox
Last Analysis can be read here
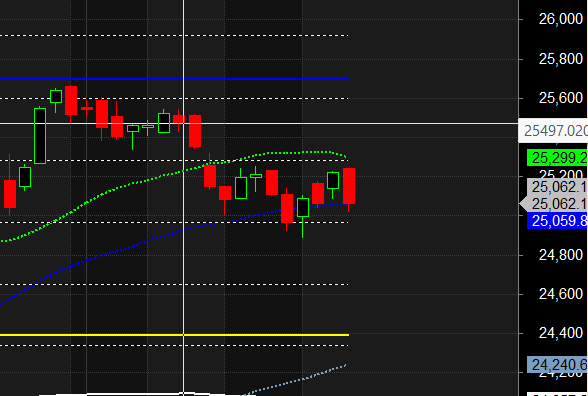
The bears had a field day today. As we discussed, the selling pressure that has been building all week finally broke through, dragging the Nifty below the critical psychological level of 25,108 and, more importantly, below its key 50-day Simple Moving Average. This is not just a dip; it’s a significant technical breakdown, and the culprits are clear: the heavyweight IT stocks are acting as an anchor, pulling the entire index down with them.
This move has set the stage for a high-stakes battle for today’s weekly close, a battle that will likely determine the trend for the entire, action-packed monthly expiry week ahead. The market is now at a critical fault line, and the aftershocks are just beginning.
The Bearish Catalyst: A Perfect Storm for IT Stocks
The weakness in the Nifty is not broad-based; it’s a targeted strike originating from the IT sector, which is being hit by a powerful one-two punch:
-
Unimpressive Q1 Earnings: The earnings season for the IT sector has been lackluster at best. The forward guidance and commentary have failed to inspire confidence, leaving investors with little reason to buy and every reason to sell.
-
Soaring US Yields: Compounding the problem, US Treasury yields are climbing again, fueled by optimism around trade talks. This is a direct headwind for growth-oriented sectors like IT. When yields on “risk-free” government bonds rise, the future cash flows of growth companies are discounted more heavily, making them less attractive to institutional investors. This is causing a classic rotation out of IT and into other sectors.
This combined pressure has turned the IT sector into a millstone around the Nifty’s neck, providing the perfect justification for the bears to press their advantage.
The Technical Damage: The Battle for the Weekly Close at 25,000
The close below the 50 SMA is a significant victory for the bears. This moving average is a key trend indicator watched by institutions, and a break below it often signals a shift from a bullish to a bearish-to-neutral market structure.
However, the entire game now comes down to today’s weekly close. The number that matters is 25,000.
-
The week’s opening price was right around this level, turning 25,000 into a powerful “price magnet.” Both bulls and bears have a vested interest in controlling the close around this mark.
-
A weekly close decisively below 25,000 would be a catastrophic failure for the bulls. It would confirm the breakdown of the 50 SMA, lock in the bearish sentiment, and open the door for a much bigger fall in the upcoming monthly expiry week.
-
A weekly close right around 25,000 would form a Doji candle on the weekly chart. A Doji is a sign of perfect equilibrium and extreme indecision. This would be the market’s way of “coiling the spring” before a massive, trending move next week.
The Cosmic Catalyst: The Mercury Declination Guarantees a Trending Move
Adding a powerful layer of timing to this setup is the recent Mercury Extreme Declination. In financial astrology, this event is known to be a powerful catalyst, often triggering a high-momentum, trending move that unfolds over the next two trading sessions.
This is why a potential weekly Doji today is so significant. It’s not just a sign of a pause; it’s a sign of immense energy being stored right before a known astrological trigger for a trend release. The market is compressing its volatility today to set up an explosive move for next week.
Nifty Trade Plan for Positional Trade ,Bulls will get active above 25118 for a move towards 25197/25276. Bears will get active below 25000 for a move towards 24924/24845
Traders may watch out for potential intraday reversals at 09:52,11:08,1:14,02:50 How to Find and Trade Intraday Reversal Times
Nifty July Futures Open Interest Volume stood at 12.3 lakh cr , witnessing liquidation of 3.9 Lakh contracts. Additionally, the increase in Cost of Carry implies that there was closure of SHORT positions today.
Nifty Advance Decline Ratio at 14:35 and Nifty Rollover Cost is @24321 closed above it.
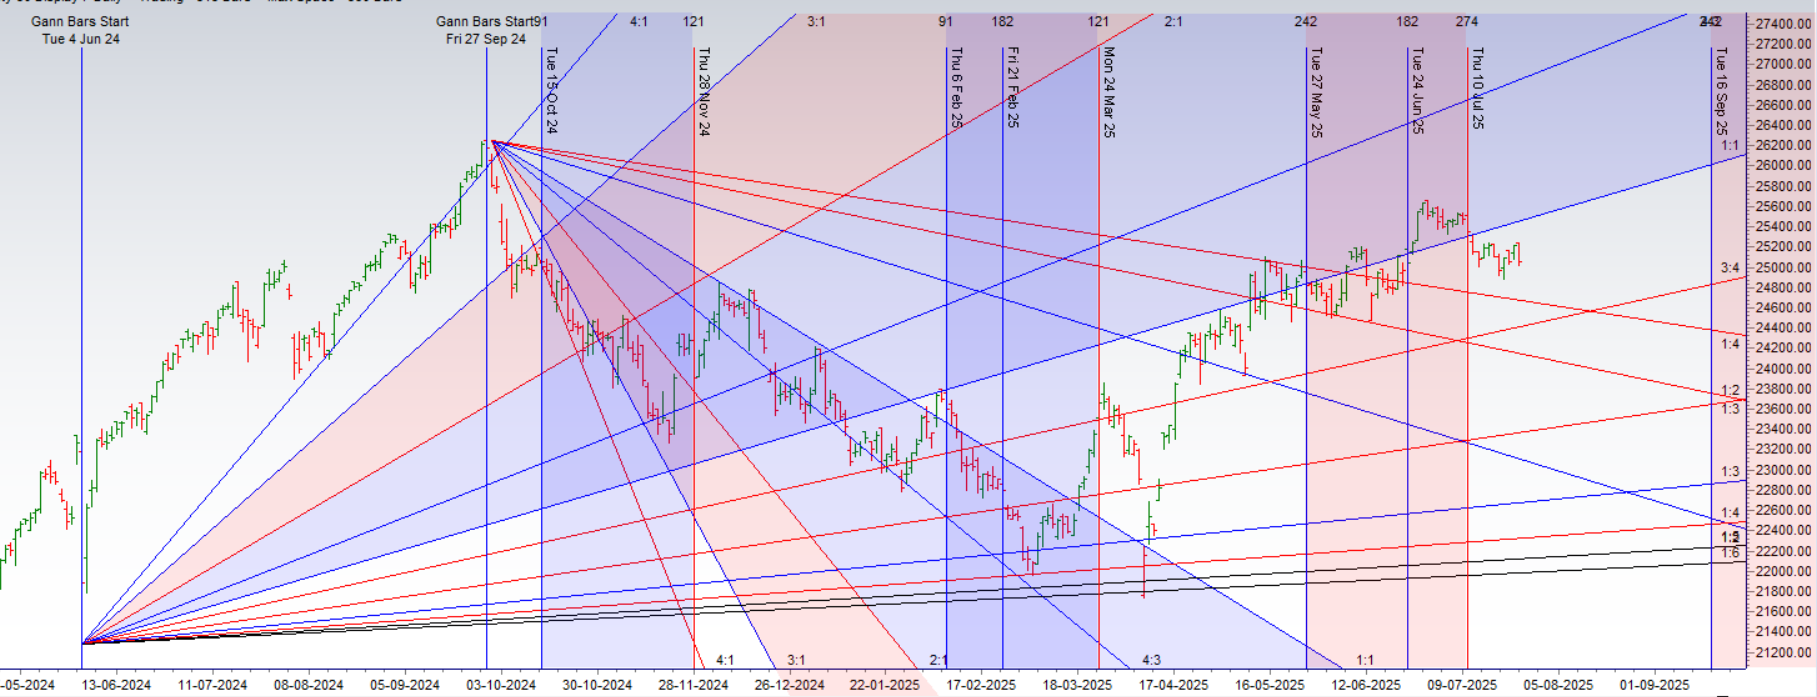
Nifty Gann Monthly Buy Level : 25709
Nifty Gann Monthly Sell Level : 25393
Nifty has closed below its 50 SMA @ 25035 Trend is Sell on Rise till below 25100
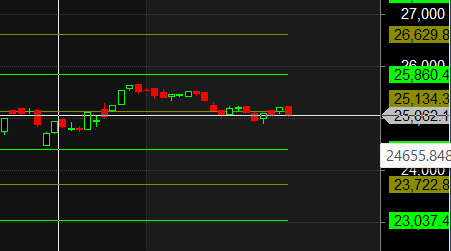
Nifty options chain shows that the maximum pain point is at 25100 and the put-call ratio (PCR) is at 0.70.Typically, when the PCR open interest ranges between 0.90 and 1.05, the market tends to remain range-bound.
Nifty 50 Options Chain Analysis
The Nifty 50 options chain indicates that the highest open interest (OI) on the call side is at the 25100 strike, followed by 25300 strikes. On the put side, the highest OI is at the 25000 strike, followed by 24800 strikes. This suggests that the market participants are expecting Nifty 50 to remain range between 24800-25200 levels.
In the cash segment, Foreign Institutional Investors (FII) sold 2133 cr , while Domestic Institutional Investors (DII) bought 2617 cr.
Traders who follow the musical octave trading path may find valuable insights in predicting Nifty’s movements. According to this path, Nifty may follow a path of 23037-23722-24408-25134-25860 This means that traders can take a position and potentially ride the move as Nifty moves through these levels.Of course, it’s important to keep in mind that trading is inherently risky and market movements can be unpredictable.
Every trader has two accounts: the one with their broker and the one in their mind. We spend countless hours managing the first, but it is the second that truly dictates our success or failure. The entire field of the psychology of trading is built on this truth.
For Positional Traders, The Nifty Futures’ Trend Change Level is At 25383. Going Long Or Short Above Or Below This Level Can Help Them Stay On The Same Side As Institutions, With A Higher Risk-reward Ratio. Intraday Traders Can Keep An Eye On 25136, Which Acts As An Intraday Trend Change Level.
Nifty Intraday Trading Levels
Buy Above 25025 Tgt 25075, 25108 and 25144 ( Nifty Spot Levels)
Sell Below 24980 Tgt 24925, 24888 and 24824 (Nifty Spot Levels)
Wishing you good health and trading success as always.As always, prioritize your health and trade with caution.
As always, it’s essential to closely monitor market movements and make informed decisions based on a well-thought-out trading plan and risk management strategy. Market conditions can change rapidly, and it’s crucial to be adaptable and cautious in your approach.
► Join Youtube channel : Click here
► Check out Gann Course Details: W.D. Gann Trading Strategies
► Check out Financial Astrology Course Details: Trading Using Financial Astrology
► Check out Gann Astro Indicators Details: Gann Astro Indicators