


FIIs Build Shorts, Clients Show Mixed Signals
As the market opened for a new month on July 1st, all eyes were on the positioning of institutional players. The latest derivatives data reveals a fascinating divergence in sentiment between Foreign Institutional Investors (FIIs) and retail clients.
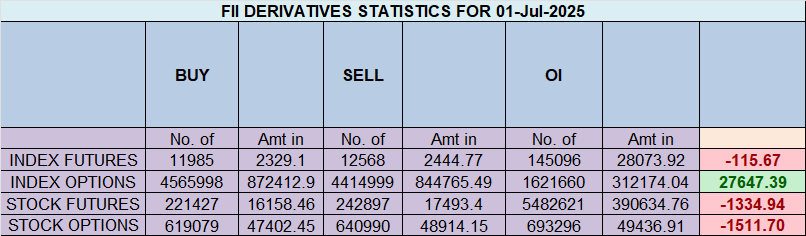
Here’s the summary of the day’s key activities in the Nifty Index Futures market:
Foreign Institutional Investors (FIIs) maintained a decidedly Bearish stance, net Shorting 373 contracts worth 71 crore. This activity fueled a significant net open interest increase of 5,459 contracts, indicating that fresh bearish bets are entering the system.
Let’s break down the activity for a clearer picture.
Breaking Down FII Activity
While the net number was short, FIIs were active on both sides. The key is where they placed their bigger bets:
-
✅ FIIs added 2,161 long contracts
-
✅ FIIs added 2,744 short contracts
The Takeaway: FIIs added significantly more short positions than long ones, reinforcing their negative outlook on the index.
Client Behaviour
The retail/client segment showed a more mixed, and arguably more cautious, approach:
-
✅ Clients covered 2,575 long contracts (Closing out bullish positions)
-
✅ Clients added 1,470 short contracts (Opening new bearish positions)
The Takeaway: Clients are reducing their bullish exposure while also cautiously adding some bearish bets.
Current Positioning: The Big Picture
The most telling data comes from the overall positioning in Index Futures, which highlights a clear clash in conviction:
▶️ FII Positioning:
-
Long/Short Split: 37:63
-
Ratio: 0.57
-
Analysis: With a ratio well below 1, FIIs are heavily positioned on the short side. For every 100 contracts they hold, 63 are betting on the market going down.
▶️ Client Positioning:
-
Long/Short Split: 51:49
-
Ratio: 1.04
-
Analysis: Clients, in stark contrast, remain marginally bullish. Their long positions slightly outnumber their short positions, creating a classic “Institutions vs. Retail” setup in the market.
Big Movers in F&O: Who Won & Who Lost BIG Last Quarter?
Last Analysis can be read here
The Nifty index has entered a state of consolidation, forming a classic NR7 pattern in today’s trading session. This pattern, which represents the narrowest trading range of the last seven days, typically signals a period of indecision and coiling energy, often preceding a significant price move.
Adding another layer to the analysis, this tight consolidation has occurred on an important astrological date noted by market timers—the Neptune Declination.
The Decisive Catalyst: HDB Listing and HDFC Bank
While the technical and cyclical patterns suggest the market is building up for a move, the trigger is already on the horizon. The market’s attention is now firmly fixed on tomorrow’s HDB Bank listing.
This event is crucial for two reasons:
-
It will directly influence the price action of its parent company, HDFC Bank.
-
As a major Nifty heavyweight, the movement in HDFC Bank’s stock will have a substantial ripple effect across the entire index.
In essence, HDFC Bank’s performance on its listing day is expected to decide the trend for the Nifty for the day. Traders will be watching its opening price and subsequent moves closely to gauge whether the coiled-up energy from the NR7 pattern will resolve to the upside or the downside.
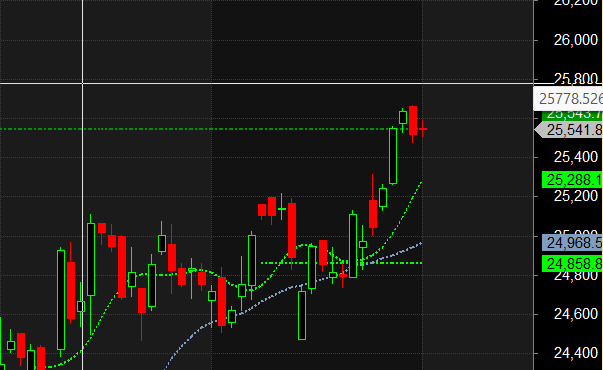
Nifty Trade Plan for Positional Trade ,Bulls will get active above 25612 for a move towards 25770/25927. Bears will get active below 25498 for a move towards 25418/25339
Traders may watch out for potential intraday reversals at 09:35,10:19,12:16,02:28 How to Find and Trade Intraday Reversal Times
Nifty July Futures Open Interest Volume stood at 14.5 lakh cr , witnessing adition of 1.31 Lakh contracts. Additionally, the increase in Cost of Carry implies that there was addiiton of LONG positions today.
Nifty Advance Decline Ratio at 28:22 and Nifty Rollover Cost is @24321 closed above it.
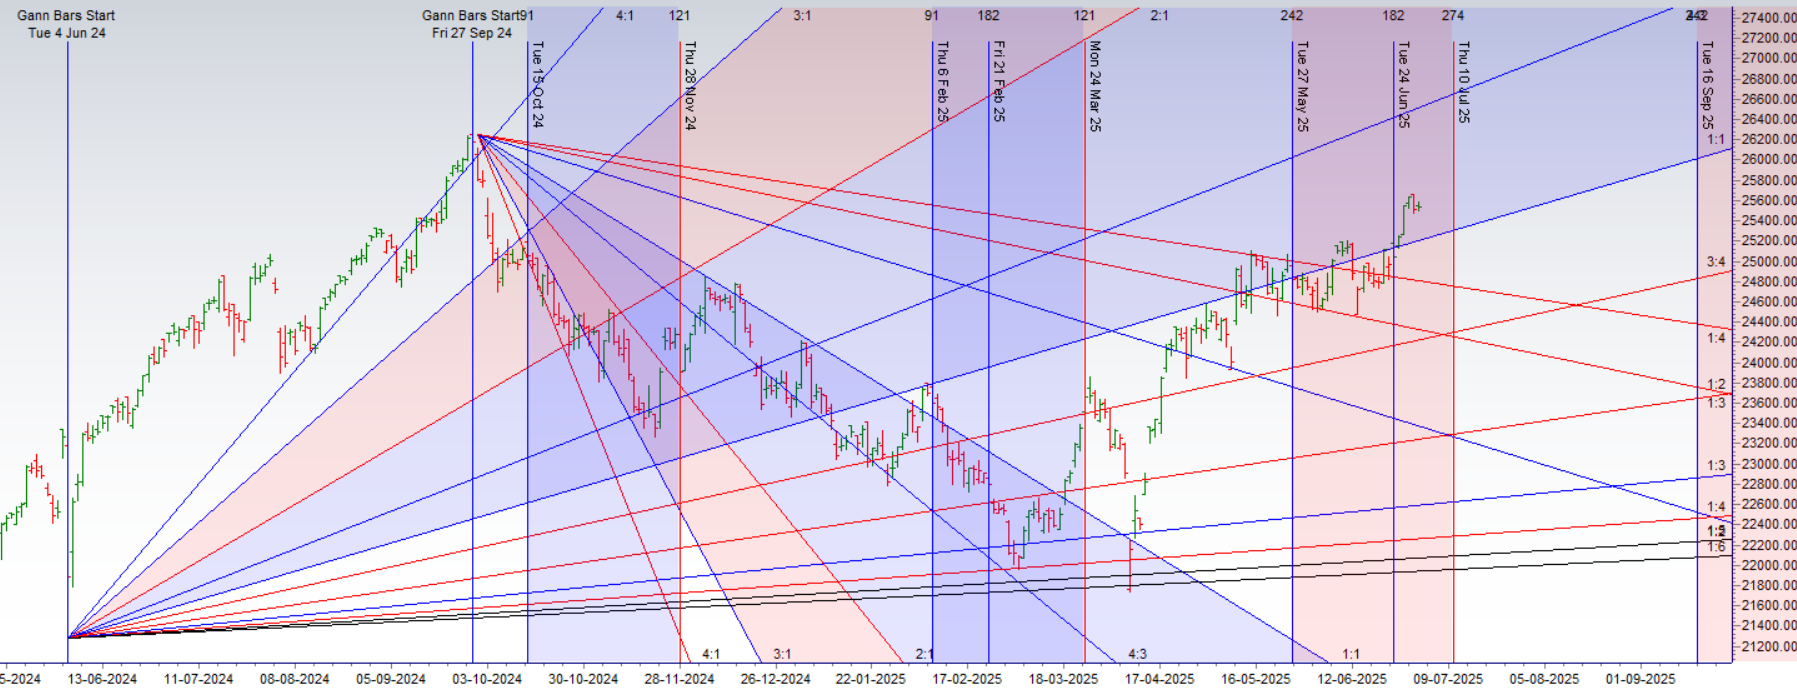
Nifty Gann Monthly Buy Level : 25709
Nifty Gann Monthly Buy Level : 25393
Nifty has closed above its 20 SMA @ 25288 Trend is Buy on Dips till above 25500.
Nifty options chain shows that the maximum pain point is at 25550 and the put-call ratio (PCR) is at 0.74.Typically, when the PCR open interest ranges between 0.90 and 1.05, the market tends to remain range-bound.
Nifty 50 Options Chain Analysis
The Nifty 50 options chain indicates that the highest open interest (OI) on the call side is at the 25600 strike, followed by 25700 strikes. On the put side, the highest OI is at the 25500 strike, followed by 25400 strikes. This suggests that the market participants are expecting Nifty 50 to remain range between 25500-25800 levels.
Options Market Deep Dive: Retail Sells Volatility, FIIs Unwind Hedges
Retail Activity in the Options Market
Retail traders were extremely active, engaging in high-volume trades on both sides of the market, with a notable pattern emerging from their put option activity.
Call Options:
-
Added 222K contracts (Bullish bet on an upward move)
-
Shorted 179K contracts (Bearish/Neutral bet, collecting premium)
Put Options:
-
Added 205K contracts (Bearish bet on a downward move)
-
Shorted 311K contracts (Bullish/Neutral bet, collecting premium)
Analysis: The most significant action from retail traders is the massive number of puts they shorted (311K). This indicates a strong belief that the market is unlikely to see a significant fall. By selling puts, they are essentially betting that the market will remain stable or move higher, allowing them to collect the premium. While they are buying calls and puts, the dominant strategy appears to be selling puts to capitalize on time decay and limited downside.
FII Activity in the Options Market
In stark contrast, Foreign Institutional Investors (FIIs) were focused on adjusting their existing positions rather than initiating large new ones. Their moves signal a significant reduction in bearishness.
Call Options:
-
Added 32.7K contracts (A fresh bullish bet)
-
Covered 1.4K contracts (Closing short call positions, which is bullish)
Put Options:
-
Covered 94.4K contracts (Likely closing long put positions, a major bullish sign)
-
Covered 22.4K contracts (Likely closing short put positions, a minor bearish sign)
Analysis: The headline number for FIIs is the covering of 94.4K put contracts. This is a powerful move, suggesting that FIIs are unwinding their bearish hedges or outright bets against the market. Closing these protective put positions, combined with adding new call longs, points to a clear bullish shift in their options strategy. They are shedding their downside protection, indicating they see less risk of a market decline in the near term.
In the cash segment, Foreign Institutional Investors (FII) sold 1970 cr , while Domestic Institutional Investors (DII) bought 771 cr.
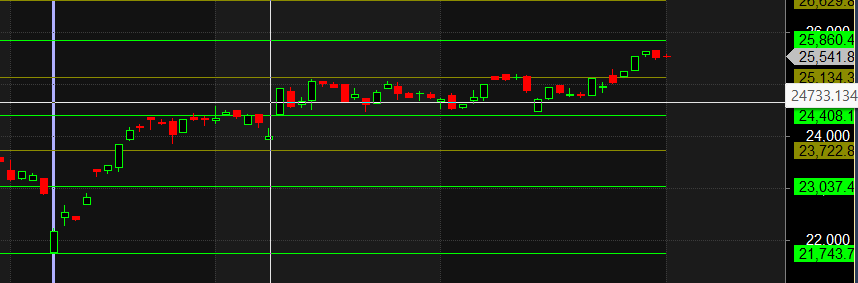
Traders who follow the musical octave trading path may find valuable insights in predicting Nifty’s movements. According to this path, Nifty may follow a path of 23037-23722-24408-25134-25860 This means that traders can take a position and potentially ride the move as Nifty moves through these levels.Of course, it’s important to keep in mind that trading is inherently risky and market movements can be unpredictable.
Don’t trade on emotion. Trading is a numbers game, and it’s important to make decisions based on logic and analysis, not emotion.
For Positional Traders, The Nifty Futures’ Trend Change Level is At 25384. Going Long Or Short Above Or Below This Level Can Help Them Stay On The Same Side As Institutions, With A Higher Risk-reward Ratio. Intraday Traders Can Keep An Eye On 24645, Which Acts As An Intraday Trend Change Level.
Nifty Intraday Trading Levels
Buy Above 25600 Tgt 25636, 25666 and 25700 ( Nifty Spot Levels)
Sell Below 25555 Tgt 25512, 25470 and 25420 (Nifty Spot Levels)
Wishing you good health and trading success as always.As always, prioritize your health and trade with caution.
As always, it’s essential to closely monitor market movements and make informed decisions based on a well-thought-out trading plan and risk management strategy. Market conditions can change rapidly, and it’s crucial to be adaptable and cautious in your approach.
► Join Youtube channel : Click here
► Check out Gann Course Details: W.D. Gann Trading Strategies
► Check out Financial Astrology Course Details: Trading Using Financial Astrology
► Check out Gann Astro Indicators Details: Gann Astro Indicators