


FII & Client Activity – April 16, 2024
FIIs Cover Shorts, Maintain Bullish Stance
Foreign Institutional Investors (FIIs) continued to lean bullish, actively buying index futures and covering a significant portion of their short positions. However, their overall positioning remains heavily short-biased, indicating a cautious yet improving sentiment.
FII Activity Snapshot
-
Contracts Bought: 7,171
-
Value: ₹1,256 crore
-
Net OI Change: Decreased by 6,315 contracts → Indicates short covering
Breakdown:
-
✔ Added Longs: 4,143 contracts
-
✔ Covered Shorts: 9,744 contracts
Long-to-Short Ratio: 0.39
Positioning: 21% Long : 79% Short
✅ Interpretation: While FIIs are still largely short, the aggressive short covering signals a shift in sentiment and potential bottoming out behavior.
Client Activity Snapshot
-
✔ Covered Longs: 8,630 contracts
-
✔ Covered Shorts: 4,033 contracts
Long-to-Short Ratio: 1.32
Positioning: 58% Long : 42% Short
✅ Interpretation: Clients continue to maintain a bullish bias, though their covering on both sides suggests position lightening ahead of key triggers (e.g., earnings, global events).
Market Takeaway
-
FIIs reducing shorts → Suggests a de-risking of bearish bets and possible shift to neutral.
-
Clients still long-heavy, but slightly defensive.
-
If FIIs continue covering shorts and add to longs, it may trigger a sentiment-driven rally, especially if Nifty holds above key resistance levels.
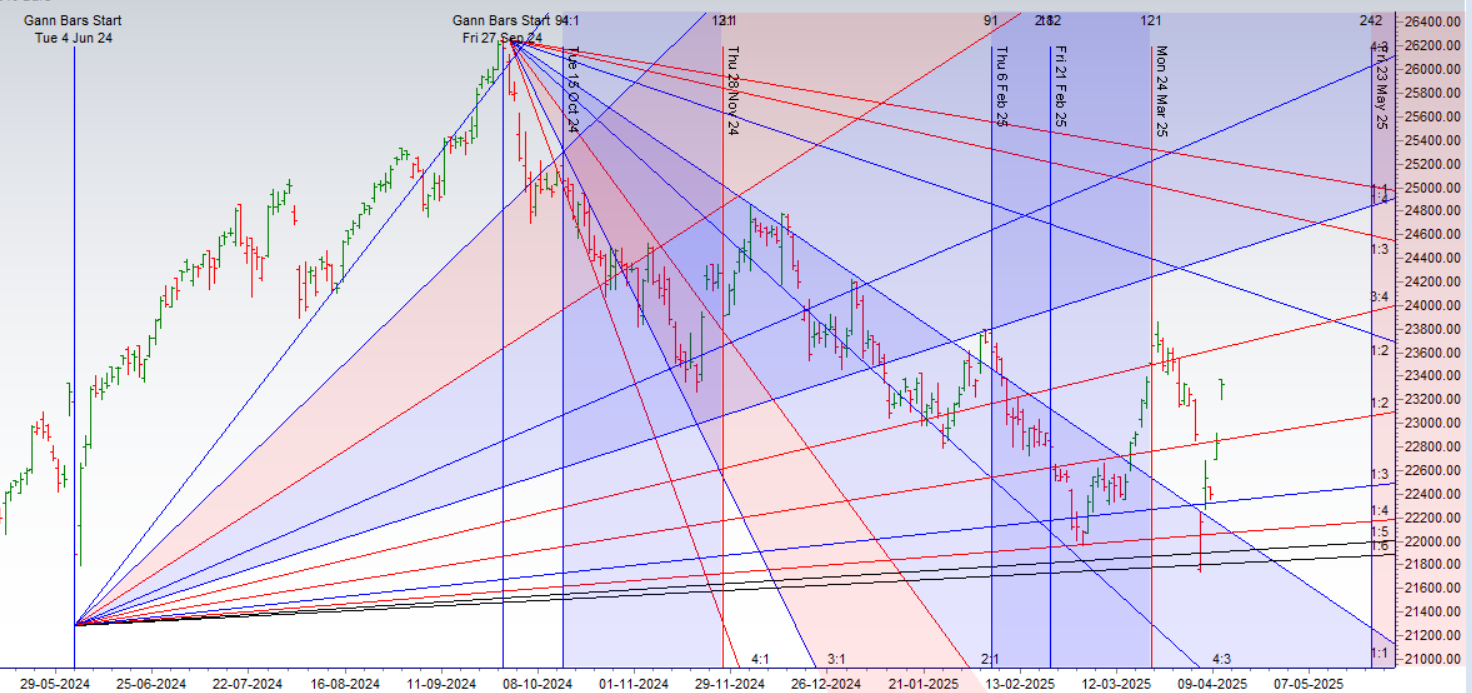
How to Use Gann Time Cycles to Predict Gold and Crude Oil Reversals
RBI Rate Cut + Trump Tariff Pause = Perfect Combo for Bulls
A powerful combination of positive domestic and global cues is expected to lift market sentiment going into the weekend. The RBI has delivered the anticipated rate cut, and Trump has announced a pause on tariffs, creating a bullish setup for the next session.
Astrological Drivers – New Trend Incoming?
Two significant planetary aspects are aligning, as explained in the video below. These events are known to mark major market turning points:
-
☿ Mercury Conjunct North Node → Signals clarity and sudden directional moves.
-
♂ Mars Trine North Node → Involves Mars, ruler of the year, and the North Node (Rahu), both associated with volatility, aggression, and rapid shifts.
When Mars and the North Node interact, markets tend to experience strong breakouts or breakdowns.
️ Weekly Close & Holiday Ahead
-
Key Bullish Level: Close above 22,939 → Strong finish for bulls.
-
Key Bearish Level: Close below 22,848 → Bears could regain short-term control.
-
Monday is a Trading Holiday → Expect increased position adjustments in the last hour of trade.
-
Overnight trades should be carried with proper hedges, given the volatility and astro triggers.
Outlook: Time Correction Ahead?
With a highly volatile week behind us, markets may now enter a time correction phase for the next 3–4 sessions. Expect sideways consolidation unless a major trigger unfolds.
Nifty opened with another gap-up, completely recovering the losses from the Trump tariff announcement — becoming the first major global index to do so.
This highlights the resilience of the Indian market, and shows that being less export-dependent and having limited exposure to U.S.-centric trade flows can be an advantage in times of geopolitical tension.
Astro Highlights Driving Short-Term Volatility
-
Yesterday: Venus turned direct in Pisces
-
Today: Mercury enters Aries
Both Venus and Mercury are inner planets, which tend to impact short-term market trends. When these two shift back-to-back, it often increases intraday volatility, making it more suitable for short-term or intraday trading strategies.
Intraday Strategy – Levels to Watch
✅ First 15-Minute High & Low will be critical to set the tone for the day — use this to capture intraday momentum.
Bullish Scenario
-
As long as Nifty holds above 23,175, bulls are in control.
-
Upside Targets:
-
23,521 – Gann resistance
-
23,666 – Higher supply zone
-
Bearish Scenario
-
If 23,175 breaks decisively, bears may take charge.
-
Downside Targets:
-
23,033 – Immediate support
-
22,900 – Gann angle & swing zone
-
With astro events aligning and technical levels being tested, expect volatility but also trading opportunities. Use defined risk, focus on intraday setups, and avoid overnight exposure unless hedged.
Nifty Trade Plan for Positional Trade ,Bulls will get active above 23298 for a move towards 23243/23549 Bears will get active below 22800 for a move towards 22637/22337
Traders may watch out for potential intraday reversals at 09:15,10:43,12:27,01:39,02:34 How to Find and Trade Intraday Reversal Times
Nifty April Futures Open Interest Volume stood at 1.23 lakh cr , witnessing liquidation of 5.3 Lakh contracts. Additionally, the decrease in Cost of Carry implies that there was closure of SHORT positions today.
Nifty Advance Decline Ratio at 48:02 and Nifty Rollover Cost is @22900 closed below it.
Nifty Gann Monthly Trade level :22835 closed below it
Nifty has closed Above its 20 SMA @ 23050 Trend is Buy on Dips till above 23050

Nifty options chain shows that the maximum pain point is at 23250 and the put-call ratio (PCR) is at 0.81 .Typically, when the PCR open interest ranges between 0.90 and 1.05, the market tends to remain range-bound.
Nifty 50 Options Chain Analysis
The Nifty 50 options chain indicates that the highest open interest (OI) on the call side is at the 23400 strike, followed by 23600 strikes. On the put side, the highest OI is at the 23200 strike, followed by 23100 strikes. This suggests that the market participants are expecting Nifty 50 to remain range between 23100-23500 levels.
In the cash segment, Foreign Institutional Investors (FII) bought 6065 Cr , while Domestic Institutional Investors (DII) Sold 1951 cr.
Traders who follow the musical octave trading path may find valuable insights in predicting Nifty’s movements. According to this path, Nifty may follow a path of 22094-22751-23408-24105-24801 This means that traders can take a position and potentially ride the move as Nifty moves through these levels.Of course, it’s important to keep in mind that trading is inherently risky and market movements can be unpredictable.

Don’t trade without a plan. Before you start trading, it’s important to have a plan in place. This plan should include your trading goals, your risk tolerance, and your trading strategy.
For Positional Traders, The Nifty Futures’ Trend Change Level is At 22998 . Going Long Or Short Above Or Below This Level Can Help Them Stay On The Same Side As Institutions, With A Higher Risk-reward Ratio. Intraday Traders Can Keep An Eye On 23351, Which Acts As An Intraday Trend Change Level.
Nifty Intraday Trading Levels
Buy Above 23314 Tgt 23365, 23424 and 23484 ( Nifty Spot Levels)
Sell Below 23287 Tgt 23234, 23199 and 23140 (Nifty Spot Levels)
Wishing you good health and trading success as always.As always, prioritize your health and trade with caution.
As always, it’s essential to closely monitor market movements and make informed decisions based on a well-thought-out trading plan and risk management strategy. Market conditions can change rapidly, and it’s crucial to be adaptable and cautious in your approach.
► Join Youtube channel : Click here
► Check out Gann Course Details: W.D. Gann Trading Strategies
► Check out Financial Astrology Course Details: Trading Using Financial Astrology
► Check out Gann Astro Indicators Details: Gann Astro Indicators