


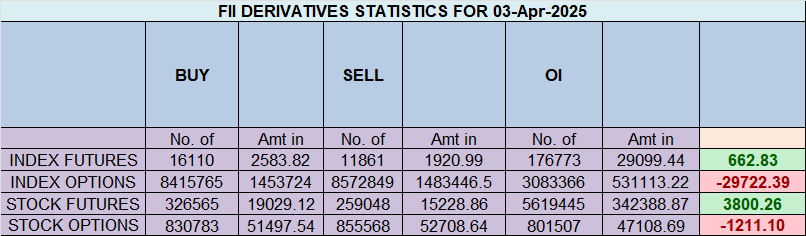
FII & Client Activity in Index Futures – April 1, 2024
Foreign Institutional Investors (FIIs) maintained a bullish stance, actively buying contracts worth ₹305 crore. This led to a net open interest (OI) increase of 233 contracts, signaling fresh long additions.
Breaking Down FII Activity
✔ FIIs added 4,604 long contracts → Increasing their bullish exposure.
✔ FIIs added 355 short contracts → Slight increase in bearish bets.
FII Long-to-Short Ratio: 0.47 → Still short-heavy, but building longs gradually.
FII Positioning: 32:68 (Long:Short)
Client Behavior
✔ Clients covered 6,669 long contracts → Possibly booking profits.
✔ Clients covered 665 short contracts → Reducing bearish bets.
Client Long-to-Short Ratio: 1.25 → Clients remain bullish overall, expecting further upside.
Client Positioning: 56:44 (Long:Short)
Market Implications
-
FIIs are reducing bearish exposure but remain short-heavy.
-
Clients are maintaining a bullish bias but booking profits.
-
Volatility likely to persist as traders adjust positions post-expiry.
The ‘formula’ for trading Success :Consistency
Nifty Snaps 5-Series Losing Streak
✅ NSE defers expiry shift from Thursday to Monday—a move closely watched by traders.
✅ Nifty gained 1,047 points in March, breaking a 5-series losing streak—strong comeback!
✅ April seasonality favors bulls—Nifty closed lower only twice in the last 10 years during April series.
✅ Nifty rollovers at 76%, below the 3-month average of 81%—suggests lower carry-forward positions.
✅ FIIs turned net buyers, with FII long positions at 40%, the highest since October 2024.
Key Triggers Ahead:
RBI Policy (April 5) – Market eyes rate stance & liquidity measures.
Q4 Earnings Season – IT & banking stocks to set the tone.
US Tariffs & Global Cues – Potential volatility ahead.
Today marks the weekly, monthly, quarterly, and financial year-end close as March 31 is a trading holiday. Additionally, a Solar Eclipse over the weekend could lead to high volatility and a gap opening on April 1.
Key Levels to Watch for Bank Nifty
✔ Quarterly Open: 23637
✔ CMP: 23591
✔ Bearish Close Target: 23521-23485
✔ Bullish Close Target: Above 23729
Last 1 Hour of Trading = High Volatility
Expect wild swings due to adjustments in Reliance & HUL and ITC, especially for tax-loss harvesting.
Risk Management for Overnight Positions
Carry hedged positions, as the market could open with a significant gap-up or gap-down on Monday.
Trump’s Retaliatory Tariffs Take Effect → Could weigh on global equities, especially trade-sensitive sectors.
US Bond Yields Falling → Signals risk-off sentiment but could support emerging markets.
Dollar Index Weakening → Generally positive for EMs, limiting the downside impact on India.
Astro Analysis: Mercury at 0° Declination – A Key Market Turning Point
-
Declination determines how high a planet rises or sets in the sky, influencing market cycles.
-
When Mercury reaches 0° declination, it aligns with the celestial equator, often marking trend shifts or volatility spikes.
-
Historically, major reversals or sharp directional moves have occurred around such planetary alignments.
Key Technical Levels for Bank Nifty
Support & Potential Reversal Zone
-
23108– 23070 → If Nifty holds this zone, expect a sharp recovery with upside targets at 23222-233000.
Breakdown Levels & Bearish Targets
-
Below 23050 → Bears could take control, dragging prices toward 22920-22800
Intraday Trading Strategy
Watch the First 15-Minute High & Low → This will set the intraday trend direction.
Volatility Expected in First Half → Due to astro alignment & global uncertainty.
Astro & macro factors align for a high-volatility session. Stay cautious, hedge positions, and avoid excessive leverage.
Nifty Trade Plan for Positional Trade ,Bulls will get active above 23258 for a move towards 23334/23411 Bears will get active below 23104 for a move towards 23027/22951
Traders may watch out for potential intraday reversals at 10:23,11:24,12:15,12:56,02:12 How to Find and Trade Intraday Reversal Times
Nifty April Futures Open Interest Volume stood at 1.26 lakh cr , witnessing addition of 2.4 Lakh contracts. Additionally, the increase in Cost of Carry implies that there was addition of SHORT positions today.
Nifty Advance Decline Ratio at 30:20 and Nifty Rollover Cost is @23797 closed below it.
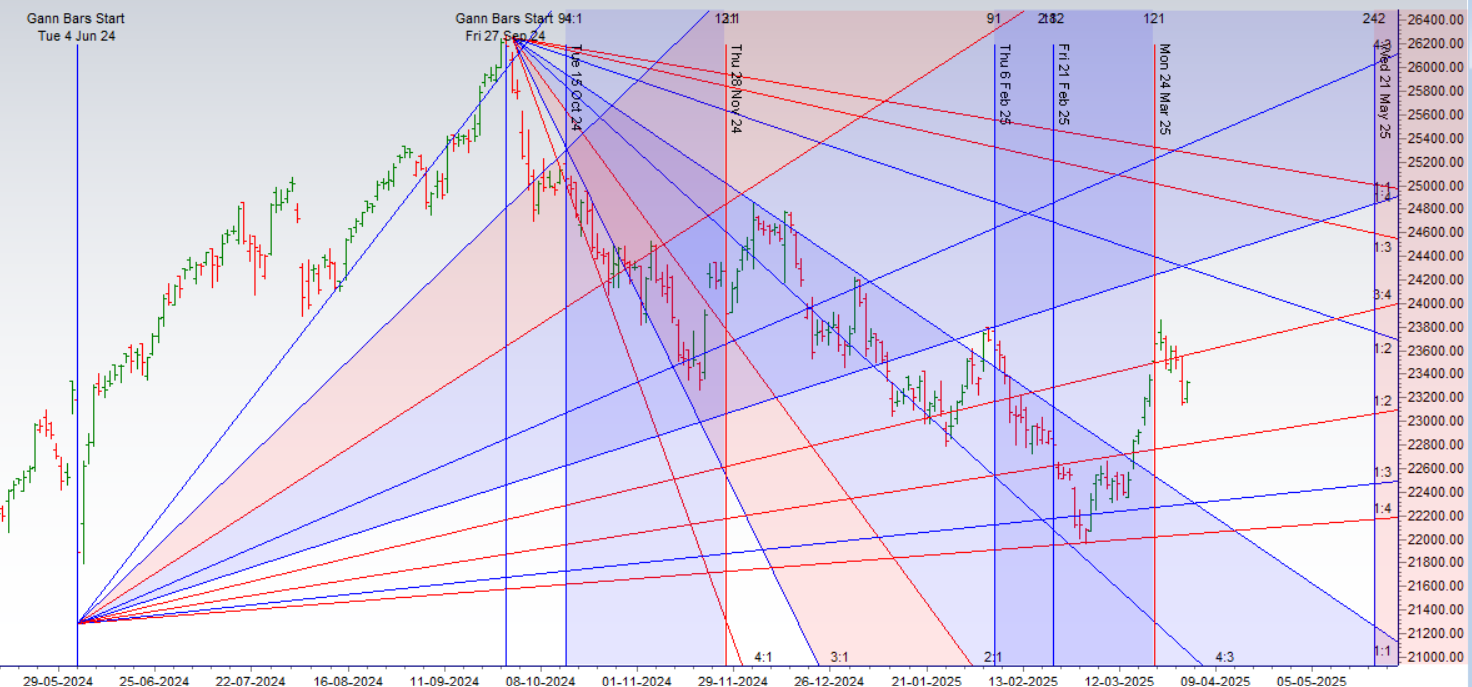
Nifty Gann Monthly Trade level :23979 closed above it
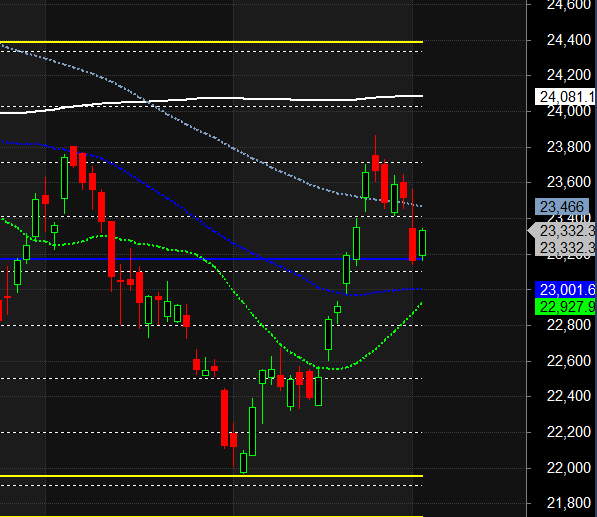
Nifty has closed Below its 200 SMA @ 23563 Trend has changed to Sell on Rise till below 23500
Nifty options chain shows that the maximum pain point is at 23300 and the put-call ratio (PCR) is at 0.87 .Typically, when the PCR open interest ranges between 0.90 and 1.05, the market tends to remain range-bound.
Nifty 50 Options Chain Analysis
The Nifty 50 options chain indicates that the highest open interest (OI) on the call side is at the 23300 strike, followed by 23400 strikes. On the put side, the highest OI is at the 23100 strike, followed by 23000 strikes. This suggests that the market participants are expecting Nifty 50 to remain range between 23000-23400 levels.
Retail & FII Activity in the Options Market – April 1, 2024
Retail Activity in Options Market
Call Options:
✔ Covered 132K contracts → Reducing long call positions.
✔ Covered 91K contracts → Reducing short call positions.
Put Options:
✔ Added 635K contracts → Increased protection against downside risk.
✔ Shorted 479K contracts → Expecting support levels to hold.
Retail traders are adding more put options, indicating increased caution and hedging against a potential decline.
FII Activity in Options Market
Call Options:
✔ Added 57K contracts → Increasing bullish exposure via calls.
✔ Shorted 108K contracts → Expecting resistance at higher levels.
Put Options:
✔ Added 42K contracts → Increasing downside protection.
✔ Shorted 148 contracts → Limited bearish positioning.
FIIs are selling more calls than buying, suggesting they anticipate limited upside. Their put activity indicates mild bearish sentiment.
In the cash segment, Foreign Institutional Investors (FII) sold 1538 Cr , while Domestic Institutional Investors (DII) bought 2808 cr.
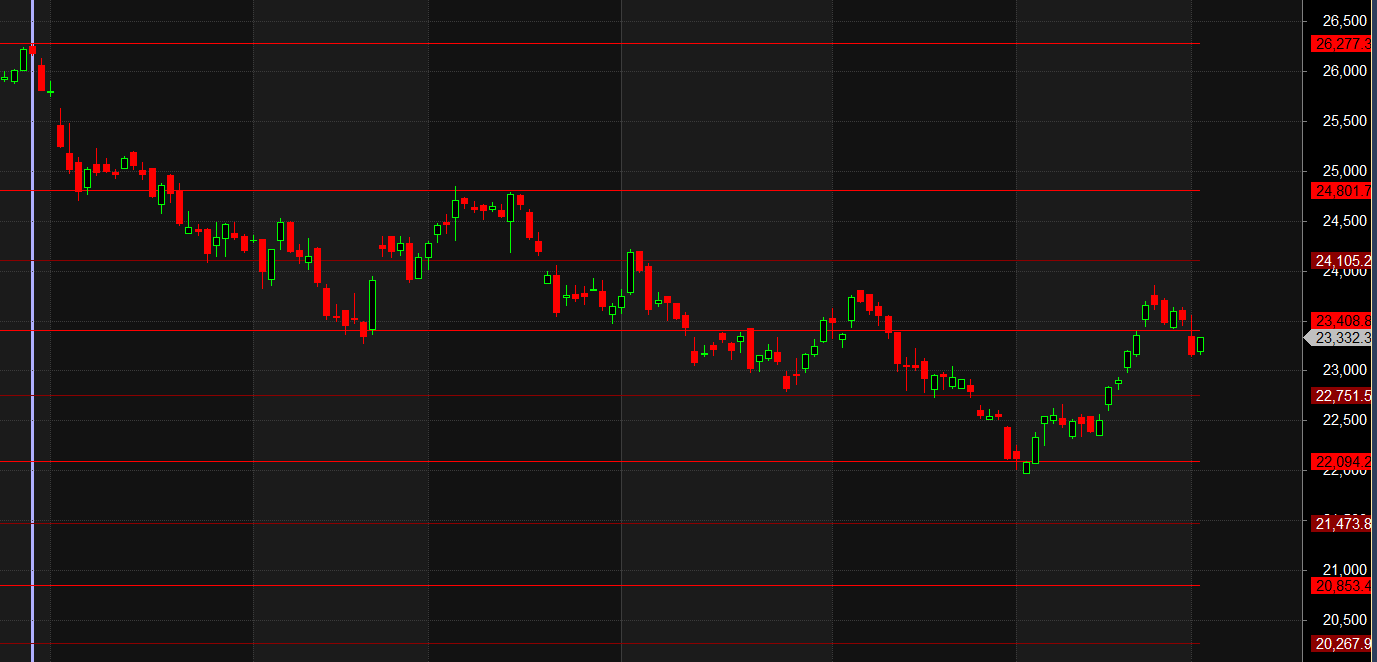
Traders who follow the musical octave trading path may find valuable insights in predicting Nifty’s movements. According to this path, Nifty may follow a path of 22094-22751-23408-24105-24801 This means that traders can take a position and potentially ride the move as Nifty moves through these levels.Of course, it’s important to keep in mind that trading is inherently risky and market movements can be unpredictable.
A trading strategy is the same; you need to be faithful to it for it to give back to you.
For Positional Traders, The Nifty Futures’ Trend Change Level is At 23264 . Going Long Or Short Above Or Below This Level Can Help Them Stay On The Same Side As Institutions, With A Higher Risk-reward Ratio. Intraday Traders Can Keep An Eye On 23435 , Which Acts As An Intraday Trend Change Level.
Nifty Intraday Trading Levels
Buy Above 23166 Tgt 23199, 23250 and 23300 ( Nifty Spot Levels)
Sell Below 23120 Tgt 23080, 23044 and 23000 (Nifty Spot Levels)
Expiry Range
Upper End of Expiry : 23320
Lower End of Expiry : 22980
Wishing you good health and trading success as always.As always, prioritize your health and trade with caution.
As always, it’s essential to closely monitor market movements and make informed decisions based on a well-thought-out trading plan and risk management strategy. Market conditions can change rapidly, and it’s crucial to be adaptable and cautious in your approach.
► Join Youtube channel : Click here
► Check out Gann Course Details: W.D. Gann Trading Strategies
► Check out Financial Astrology Course Details: Trading Using Financial Astrology
► Check out Gann Astro Indicators Details: Gann Astro Indicators