


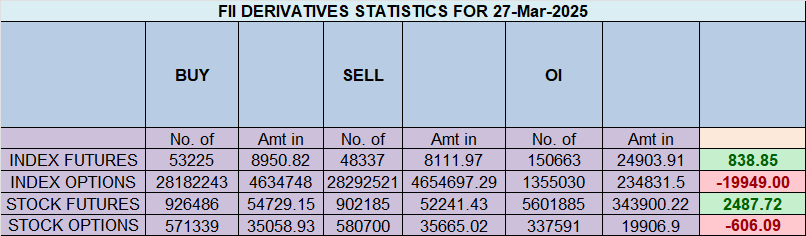
FII & Client Activity – Expiry Day Adjustments
Foreign Institutional Investors (FIIs) remained bullish, actively buying 2,416 contracts worth ₹416 crore. However, the monthly expiry led to a massive open interest (OI) unwinding of 67,486 contracts.
Breaking Down FII Activity
✔ FIIs Covered: 25,557 long contracts
✔ FIIs Covered: 78,735 short contracts
✔ FII Long-to-Short Ratio: 0.66 → Still short-heavy, but reducing bearish exposure.
Client Behavior
✔ Clients Covered: 45,230 long contracts
✔ Clients Covered: 12,523 short contracts
✔ Clients Long-to-Short Ratio: 1.06 → Slight bullish bias, but cautious.
The ‘formula’ for trading Success :Consistency
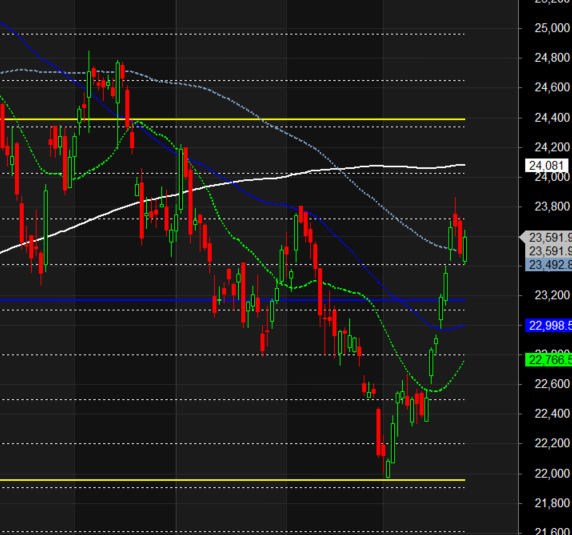
Nifty has confirmed a perfect reversal, aligning with Bayer Rule 14 & 22, as discussed in the video below. The index closed below the quarterly open price of 23,637, signaling bearish momentum.
Additionally, last month’s expiry was at 22,508, and Nifty is still 900 points above that level. However, with the current weakness, another gap-down opening is likely tomorrow.
Key Levels to Watch
Crucial Support Zone: 23,400–23,433
→ If bulls fail to defend this range, expect a further decline to 23,255.
Bullish Reversal Only Above: 23,561
→ For any meaningful upside, Nifty must reclaim 23,561.
✔ A break below 23,400 could accelerate selling toward 23,255.
✔ A bounce above 23,561 could trigger short-covering toward 23,637.
✔ Expect increased volatility—manage risk carefully.
✔ Intraday traders should focus on first 15-minute high/low for trend confirmation.
Final Thoughts: Bayer rules played out as expected—now, all eyes on 23,400 for the next major move!
Nifty Snaps 5-Series Losing Streak
✅ NSE defers expiry shift from Thursday to Monday—a move closely watched by traders.
✅ Nifty gained 1,047 points in March, breaking a 5-series losing streak—strong comeback!
✅ April seasonality favors bulls—Nifty closed lower only twice in the last 10 years during April series.
✅ Nifty rollovers at 76%, below the 3-month average of 81%—suggests lower carry-forward positions.
✅ FIIs turned net buyers, with FII long positions at 40%, the highest since October 2024.
Key Triggers Ahead:
RBI Policy (April 5) – Market eyes rate stance & liquidity measures.
Q4 Earnings Season – IT & banking stocks to set the tone.
US Tariffs & Global Cues – Potential volatility ahead.
Today marks the weekly, monthly, quarterly, and financial year-end close as March 31 is a trading holiday. Additionally, a Solar Eclipse over the weekend could lead to high volatility and a gap opening on April 1.
Key Levels to Watch for Bank Nifty
✔ Quarterly Open: 23637
✔ CMP: 23591
✔ Bearish Close Target: 23521-23485
✔ Bullish Close Target: Above 23729
Last 1 Hour of Trading = High Volatility
Expect wild swings due to adjustments in Reliance & HUL and ITC, especially for tax-loss harvesting.
Risk Management for Overnight Positions
Carry hedged positions, as the market could open with a significant gap-up or gap-down on Monday.

Nifty Trade Plan for Positional Trade ,Bulls will get active above 23637 for a move towards 23715/23792 Bears will get active below 23560 for a move towards 23483/23406
Traders may watch out for potential intraday reversals at 10:33,11:41,01:11,02:28 How to Find and Trade Intraday Reversal Times
Nifty April Futures Open Interest Volume stood at 1.24 lakh cr , witnessing addition of 24.3 Lakh contracts. Additionally, the increase in Cost of Carry implies that there was addition of LONG positions today.
Nifty Advance Decline Ratio at 35:15 and Nifty Rollover Cost is @22724 closed above it.
Nifty Gann Monthly Trade level :23979 closed above it
Nifty has closed above its 200 SMA @ 23563 Trend has changed to Sell on Rise till below 23666
Nifty options chain shows that the maximum pain point is at 23500 and the put-call ratio (PCR) is at 1.05 .Typically, when the PCR open interest ranges between 0.90 and 1.05, the market tends to remain range-bound.
Nifty 50 Options Chain Analysis
The Nifty 50 options chain indicates that the highest open interest (OI) on the call side is at the 23500 strike, followed by 23600 strikes. On the put side, the highest OI is at the 23300 strike, followed by 23200 strikes. This suggests that the market participants are expecting Nifty 50 to remain range between 23300-23600 levels.
In the cash segment, Foreign Institutional Investors (FII) bought 11111 Cr , while Domestic Institutional Investors (DII) bought 2517 cr.
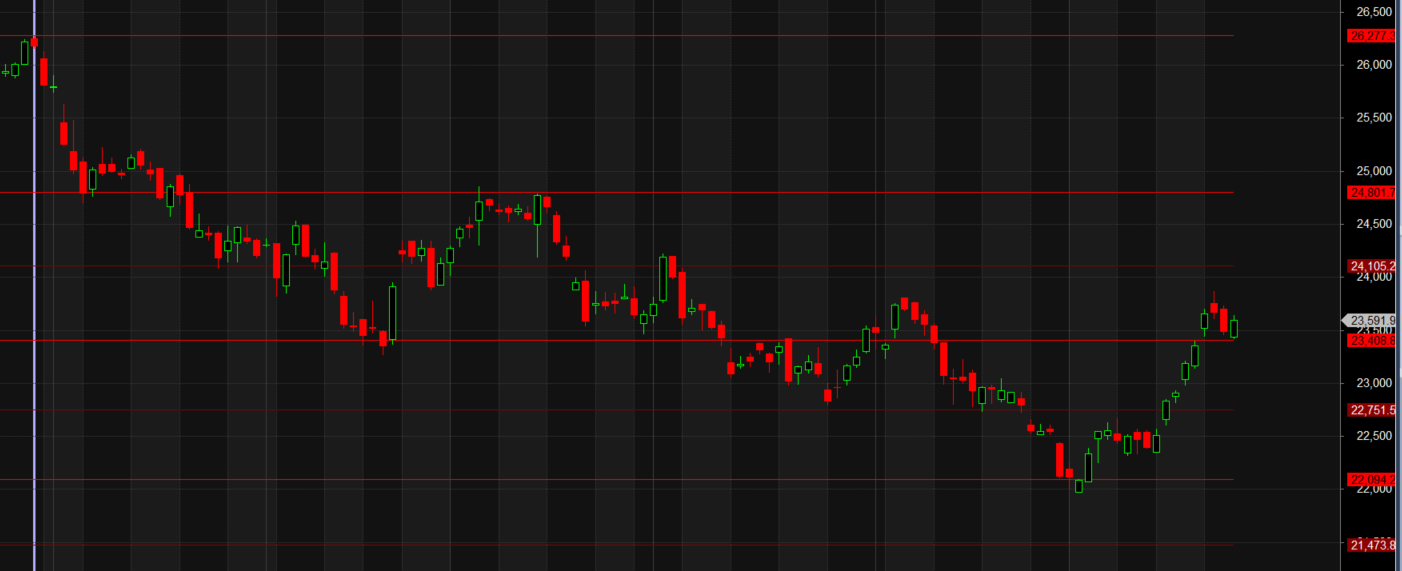
Traders who follow the musical octave trading path may find valuable insights in predicting Nifty’s movements. According to this path, Nifty may follow a path of 22094-22751-23408-24105-24801 This means that traders can take a position and potentially ride the move as Nifty moves through these levels.Of course, it’s important to keep in mind that trading is inherently risky and market movements can be unpredictable.
It’s not just putting in the hours that will make you successful; it’s the persistent intention to improve by examining your results, tweaking your approach, and making incremental progress.
For Positional Traders, The Nifty Futures’ Trend Change Level is At 23751 . Going Long Or Short Above Or Below This Level Can Help Them Stay On The Same Side As Institutions, With A Higher Risk-reward Ratio. Intraday Traders Can Keep An Eye On 23751 , Which Acts As An Intraday Trend Change Level.
Nifty Intraday Trading Levels
Buy Above 23637 Tgt 23666, 23707 and 23777 ( Nifty Spot Levels)
Sell Below 23570 Tgt 23529, 23485 and 23444 (Nifty Spot Levels)
Wishing you good health and trading success as always.As always, prioritize your health and trade with caution.
As always, it’s essential to closely monitor market movements and make informed decisions based on a well-thought-out trading plan and risk management strategy. Market conditions can change rapidly, and it’s crucial to be adaptable and cautious in your approach.
► Join Youtube channel : Click here
► Check out Gann Course Details: W.D. Gann Trading Strategies
► Check out Financial Astrology Course Details: Trading Using Financial Astrology
► Check out Gann Astro Indicators Details: Gann Astro Indicators