Foreign Institutional Investors (FIIs) displayed a bearish outlook in the Nifty Index Futures market, actively shorting 10650 contracts worth ₹893 crores. This action resulted in a significant increase of 13646 contracts in the net open interest.
Breaking down their activity:
- FIIs added 1582 long contracts and simultaneously increased 18886 short contracts.
- While this shows an effort to expand both long and short exposures, the net FII long-short ratio remains at 0.23, signaling a predominantly bearish stance.
Client Behavior:
- Clients added 17381 long contracts and covered 11557 short contracts, indicating a tilt towards building Long positions.
Current Positioning in Index Futures:
- FIIs: Holding 20% long and 80% short positions.
- Clients: Holding 68% long and 32% short positions.
This data highlights the contrasting approaches of FIIs and Clients, with FIIs maintaining a stronger bearish bias.
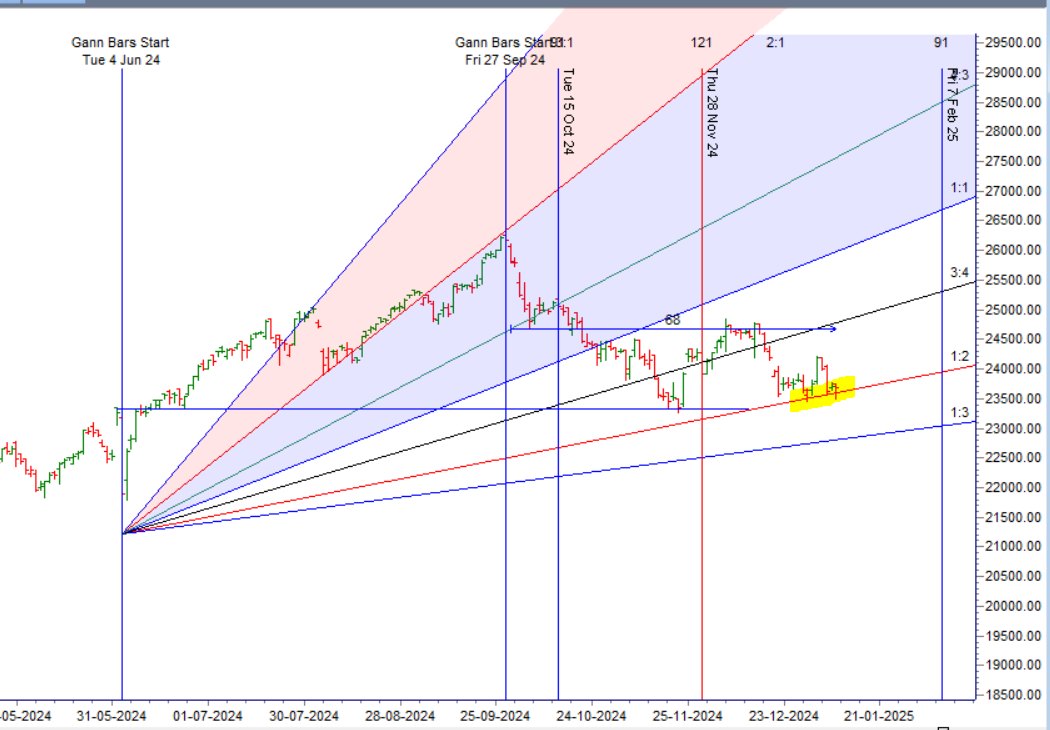
Nifty remains cautious, forming a Doji candle while trading below the critical level of 23,915, which corresponds to the 200 SMA. A decisive close above this level is necessary for bulls to mitigate the prevailing short-term bearish sentiment. Notably, the price is hovering near the Yearly Open at 23,637, and Gann Angle 1×1 Support adding significance to these levels.
Additionally, with Mercury entering Capricorn, an earth sign, the market may witness the emergence of a new trend. This cosmic influence, as highlighted in the accompanying video analysis, could bring structural shifts to the market landscape.
For intraday traders, the first 15 minutes’ high and low will act as pivotal markers, offering clarity and direction for the day’s trading.
The Mental Side: The Key to Success in Stock Market Trading
Nifty saw a voaltile move, Yesterday’s Mercury in Capricorn alignment indicated the emergence of a fresh trend, making yesterday’s low of 23496 the new critical level for bears to break. On the other hand, bulls need to push the price above 23751 for any upside momentum to materialize.
Key Astro Event Today:
We have Rule No. 38 – Mercury Latitude Heliocentric, which states:
“Some mighty fine tops and bottoms are produced when Mercury, in this motion, passes the mentioned degrees.”
The first 15 minutes’ high and low will be critical in determining today’s trend.
Additional Market Insight:
- TCS will kick off the result season today, which is expected to introduce volatility.
- TCS results will be announced after market hours, so traders should prepare for potential overnight impacts.
Nifty Trade Plan for Positional Trade ,Bulls will get active above 23666 for a move towards 23729/23779/23864 . Bears will get active below 23600 for a move towards 23555/23484.
Traders may watch out for potential intraday reversals at 10:03,11:22,01:59 How to Find and Trade Intraday Reversal Times
Nifty December Futures Open Interest Volume stood at 1.29 lakh cr , witnessing addition of 2.7 Lakh contracts. Additionally, the increase in Cost of Carry implies that there was addition of SHORT positions today.
Nifty Advance Decline Ratio at 23:27 and Nifty Rollover Cost is @25178 closed below it.
Nifty Gann Monthly Trade level :23637 close below it.
Nifty has closed below its 200 SMA @ 23923 Trend has changed to Sell on Rise till below 24000
Nifty options chain shows that the maximum pain point is at 23600 and the put-call ratio (PCR) is at 0.72 Typically, when the PCR open interest ranges between 0.90 and 1.05, the market tends to remain range-bound.
Nifty 50 Options Chain Analysis
The Nifty 50 options chain indicates that the highest open interest (OI) on the call side is at the 23700 strike, followed by 23800 strikes. On the put side, the highest OI is at the 23500 strike, followed by 23400 strikes. This suggests that the market participants are expecting Nifty 50 to remain range between 23400-23700 levels.
Retail Activity in Options Market: Bullish Bias Indicated
According to today’s data, retail investors bought 374 K Call Option contracts and shorted 196 K Call Option contracts. Additionally, they bought 247 K Put Option contracts and covered 184 KPut Option contracts, indicating a bullish bias in the market.
FII Activity in Options Market: Bearish Bias Indicated
Foreign Institutional Investors (FIIs) covered 70 K Call Option contracts and shorted 139 K Call Option contracts. On the Put side, FIIs added 70 K Put Option contracts and shorted 99 K Put Option contracts, suggesting a shift towards a bearish bias.
In the cash segment, Foreign Institutional Investors (FII) sold 1419 crores, while Domestic Institutional Investors (DII) bought 1615 crores.
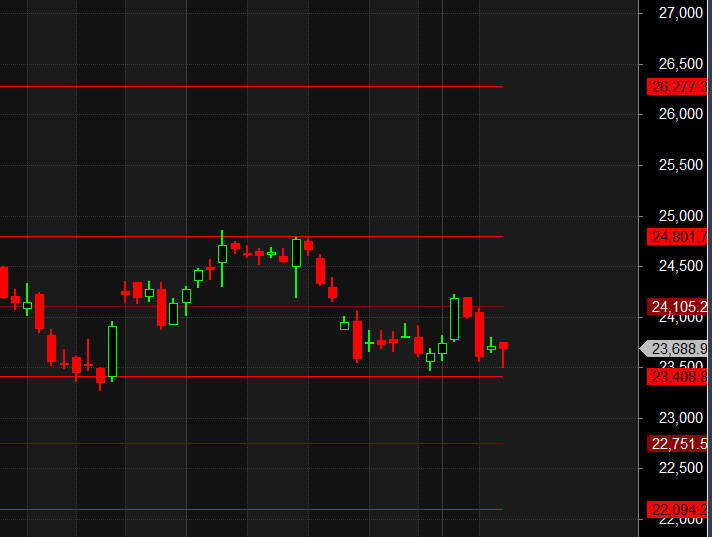
Traders who follow the musical octave trading path may find valuable insights in predicting Nifty’s movements. According to this path, Nifty may follow a path of 23408-24105-24801 This means that traders can take a position and potentially ride the move as Nifty moves through these levels.Of course, it’s important to keep in mind that trading is inherently risky and market movements can be unpredictable.
The Mental Side: The Key to Success in Stock Market Trading
For Positional Traders, The Nifty Futures’ Trend Change Level is At 23915 . Going Long Or Short Above Or Below This Level Can Help Them Stay On The Same Side As Institutions, With A Higher Risk-reward Ratio. Intraday Traders Can Keep An Eye On 23822, Which Acts As An Intraday Trend Change Level.
Nifty Intraday Trading Levels
Buy Above 23729 Tgt 23779, 23816 and 23850 ( Nifty Spot Levels)
Sell Below 23666 Tgt 23630, 23600 and 23555 (Nifty Spot Levels)
Wishing you good health and trading success as always.As always, prioritize your health and trade with caution.
As always, it’s essential to closely monitor market movements and make informed decisions based on a well-thought-out trading plan and risk management strategy. Market conditions can change rapidly, and it’s crucial to be adaptable and cautious in your approach.
► Join Youtube channel : Click here
► Check out Gann Course Details: W.D. Gann Trading Strategies
► Check out Financial Astrology Course Details: Trading Using Financial Astrology
► Check out Gann Astro Indicators Details: Gann Astro Indicators


