


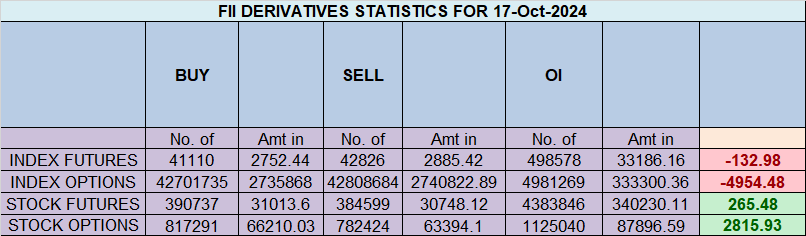
Foreign Institutional Investors (FIIs) displayed a Bearish approach in the Nifty Index Futures market by Shorting 5599 contracts worth ₹345 crores, resulting in a increase of 2215 contracts in the net open interest. FIIs added 1062 long contracts and covered 6750 short contracts, indicating a preference for adding long positions and covering short positions. With a net FII long-short ratio of 0.55, FIIs utilized the market fall to enter long positions and exit short positions in Nifty futures. Clients covered 18379 long contracts and covered 22246 short contracts. FII are holding 34 % Long and 66 % Shorts in Index Futures and Clients are holding 64 % Long and 36% Shorts in Index Futures.
FIIs have been continuously selling net equities in India. So far in October, FIIs have sold a massive ₹74,730 crore worth of shares in the market. This marks the highest-ever monthly net selling by FIIs, surpassing the previous record of ₹68,308 crore in March 2020, when COVID-19 began spreading globally.
Meanwhile, DIIs have been buying equities during the week. The heavy equity selling by FIIs yesterday could indicate that we are nearing the bottom. (I follow the premise that the equity cycle lags behind the F&O cycle, and high activity in equities generally signals the culmination of that particular cycle.)
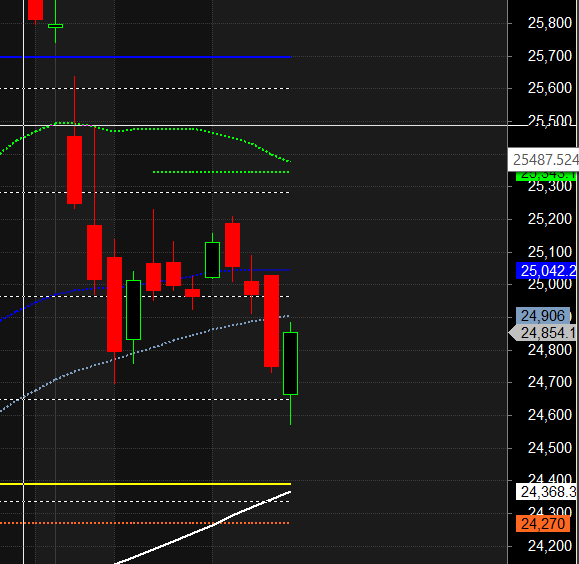
We saw the impact of the Gann and astro cycles, leading to a significant drop in Nifty as it broke the Gann angle. Tomorrow, we are likely to open with a gap down and break the last swing low of 24,694 from October 7. With Venus Ingress tomorrow, the first 15 minutes’ high and low will again be crucial in determining the day’s trend. This marks the third week of correction, with the price having already broken last month’s low of 24,754. Bulls need a move above 24,920 for a short-term bottom to form.
Nifty demonstrated the impact of Venus Ingress, with the price moving above the 15-minute high, leading to a significant upward move. We also observed Bayer Rule 14: Venus Movements in Geocentric Longitude Using a Unit of 1°9’13”, alongside the Gann 1-year cycle, as explained in the video below. This suggests a short-term bottom may be in place if Nifty closes above 24,950–25,000 in the next two trading sessions. However, if the price falls below 24,729, the bears could regain the upper hand.

Nifty Trade Plan for Positional Trade ,Bulls will get active above 24881 for a move towards 24959/25037/25116. Bears will get active below 24724 for a move towards 24646/24567/24484.
Traders may watch out for potential intraday reversals at 09:15,10:34,11:47,01:08,02:40 How to Find and Trade Intraday Reversal Times
Nifty Sep Futures Open Interest Volume stood at 1.32 lakh cr , witnessing a liquidation of 2.7 Lakh contracts. Additionally, the increase in Cost of Carry implies that there was a closure of SHORT positions today.
Nifty Advance Decline Ratio at 32:18 and Nifty Rollover Cost is @25178 closed below it.
Nifty Gann Monthly Trade level :25343 close below it.
Nifty closed Below its 50SMA @25042 Trend is Buy on Dips till above 24729
Nifty options chain shows that the maximum pain point is at 24800 and the put-call ratio (PCR) is at 0.95 Typically, when the PCR open interest ranges between 0.90 and 1.05, the market tends to remain range-bound.
Nifty 50 Options Chain Analysis
The Nifty 50 options chain indicates that the highest open interest (OI) on the call side is at the 24900 strike, followed by 25000 strikes. On the put side, the highest OI is at the 24600 strike, followed by 24500 strikes. This suggests that the market participants are expecting Nifty 50 to remain range between 24600-25000 levels.
In the cash segment, Foreign Institutional Investors (FII) sold 5485 crores, while Domestic Institutional Investors (DII) bought 5214 crores.
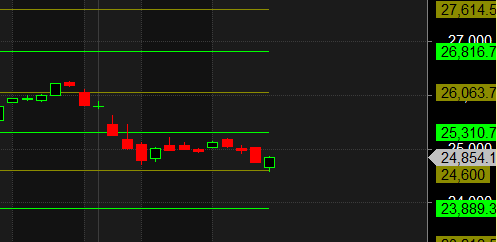
Traders who follow the musical octave trading path may find valuable insights in predicting Nifty’s movements. According to this path, Nifty may follow a path of 24600-25310-26063-26816 This means that traders can take a position and potentially ride the move as Nifty moves through these levels.Of course, it’s important to keep in mind that trading is inherently risky and market movements can be unpredictable.
As a trading psychologist, I therefore see my job not in telling you why it is, but in how you can help yourself to find your own solutions to your problems.
For Positional Traders, The Nifty Futures’ Trend Change Level is At 24396. Going Long Or Short Above Or Below This Level Can Help Them Stay On The Same Side As Institutions, With A Higher Risk-reward Ratio. Intraday Traders Can Keep An Eye On 24836, Which Acts As An Intraday Trend Change Level.
Nifty Intraday Trading Levels
Buy Above 24888 Tgt 24925, 24966 and 25008 ( Nifty Spot Levels)
Sell Below 24808 Tgt 24769, 24729 and 24666 (Nifty Spot Levels)
Wishing you good health and trading success as always.As always, prioritize your health and trade with caution.
As always, it’s essential to closely monitor market movements and make informed decisions based on a well-thought-out trading plan and risk management strategy. Market conditions can change rapidly, and it’s crucial to be adaptable and cautious in your approach.
sir do educate about nifty revised lot size and its impact on hedging