


In the world of trading, few methods have attracted as much intrigue as Gann’s Price Time Squaring formula. Developed by William Delbert Gann, a legendary figure in the financial markets, this methodology integrates both price and time into a comprehensive analytical framework. While the majority of traders focus on price movements alone, Gann’s genius lay in recognizing the importance of time in determining market shifts.
One of the most fascinating aspects of Gann’s work is his emphasis on cycles, particularly the 144-day cycle, which has gained significant attention for its predictive power in forecasting major stock breakouts. In this blog post, we’ll explore Gann’s Price Time Squaring formula, delve into the significance of the 144-day cycle, and demonstrate how to use it to predict big moves in stocks. By the end, you’ll have a practical guide on how to apply Gann’s methods in your own trading strategies.
Who Was W.D. Gann?
Before diving into the technical details of Gann’s Price Time Squaring formula, it’s important to understand the mind behind this method. W.D. Gann was a pioneering trader and financial theorist in the early 20th century. He was not only a master of technical analysis but also deeply interested in mathematics, geometry, and astrology. Gann believed that everything in the financial markets was cyclical, governed by natural laws that could be understood and applied to predict future movements. His work is often considered cryptic, but those who have studied his methods often find it incredibly insightful.
Gann’s theories are built on the relationship between price and time, as he believed that markets behave in harmony with the natural order of the universe. According to him, just as there are specific patterns in nature, there are also distinct cycles in market trends that repeat over time.
Understanding Gann’s Price Time Squaring Formula
At the core of Gann’s approach is the concept of “squaring” price and time. Gann posited that a specific relationship exists between the price of a stock and the amount of time that has passed. The key idea here is that once price and time are in harmony, significant market events, such as breakouts, are more likely to occur.
How Does Price Time Squaring Work?
In essence, Price Time Squaring occurs when a stock’s price aligns harmoniously with the passage of time, creating an equilibrium in the market. When this balance is achieved, it often signals a turning point, whether it be the beginning of a new trend or the continuation of an existing one.
To apply the Price Time Squaring method:
- Identify the price level of a stock at a key turning point.
- Measure the time that has passed since this point.
- Use the square of the price level or a relevant geometric factor to determine when price and time will align.
- Look for breakout signals that coincide with this squaring.
This methodology is particularly useful in identifying moments when major trends are about to reverse or continue, allowing traders to capitalize on big moves.
The Importance of the 144-Day Cycle
In addition to the Price Time Squaring concept, Gann was deeply focused on specific time cycles. One of the most powerful and often-referenced cycles in Gann’s work is the 144-day cycle.
Why 144?
The number 144 has mathematical and geometric significance. It’s the square of 12, a number commonly associated with the zodiac, seasonal changes, and the division of time. Gann believed that this number was key to unlocking the timing of major market moves.
In practical terms, the 144-day cycle serves as a powerful tool for identifying potential market reversals or breakouts. By examining how markets move in increments of 144 days, traders can often anticipate turning points and plan trades accordingly.
How to Apply the 144-Day Cycle in Stock Trading
Now that we’ve established the significance of the 144-day cycle and the concept of Price Time Squaring, let’s dive into a step-by-step guide for applying this strategy to predict big stock breakouts.
Step 1: Identify a Major Swing High or Low
The first step in applying the 144-day cycle is identifying a major swing high or low in the stock you’re analyzing. These points represent critical moments in the market where sentiment has shifted.
For example, if a stock has been in a prolonged downtrend and suddenly makes a strong upward move, this could be a significant swing low. Conversely, if a stock has been trending upward and reaches a peak before declining, this represents a swing high.
Step 2: Count 144 Days from the Swing Point
Once you’ve identified the swing high or low, the next step is to count forward 144 calendar days from that point. This gives you a potential window where the next significant market event could occur.
For example, if you identify a swing low on January 1st, count forward 144 days to arrive at May 25th. This date becomes an important marker for anticipating a possible breakout or reversal.
Step 3: Monitor Price Action as You Approach the 144-Day Mark
As the 144-day cycle approaches, it’s important to closely monitor price action for any signs of a breakout or reversal. Look for technical indicators such as increasing volume, breakouts above key resistance levels, or candlestick patterns that signal a shift in momentum.
One of the best ways to confirm the significance of the 144-day cycle is to see if it aligns with other technical analysis tools you may be using. If the stock is approaching a key support or resistance level at the same time, this adds further weight to the likelihood of a big move.
Step 4: Apply Gann’s Price Time Squaring Formula
In addition to counting days, you can apply Gann’s Price Time Squaring formula to further refine your analysis. To do this, take the price at the swing high or low and calculate its square root. Then, determine how many time cycles (in days) correspond to that price.
For instance, if the stock was trading at $144 at the swing low, you would calculate the square root of 144, which is 12. You can then look for time periods that are multiples of 12 days from the swing point, in addition to the 144-day cycle.
This adds another layer of precision to your trading, as it helps ensure that both price and time are in alignment before a breakout occurs.
Step 5: Look for Confluence with Other Gann Angles
Gann’s analysis doesn’t stop with just one cycle or tool. To increase your confidence in a potential breakout, look for confluence between multiple Gann techniques. For example, you could combine the 144-day cycle with a Gann Fan or Gann Square of Nine chart to see if multiple indicators point to the same breakout window.
When multiple Gann tools indicate a potential breakout, the likelihood of a significant price move increases dramatically.
Examples of Gann’s 144-Day Cycle in Action
Let’s take a look at how the 144-day cycle has been used in real trading situations.
Example 1: Stock A’s Major Breakout
Stock A experienced a significant swing low on January 1st, 2023, after months of downward pressure. From this low, the stock started to consolidate, with no major moves in the immediate future.
Counting 144 days forward from January 1st, we arrive at May 25th, 2023. As May approached, the stock showed signs of accumulation, and on May 24th, it broke above a key resistance level with increased volume. The stock surged by over 20% in the weeks following the 144-day mark, demonstrating the predictive power of this cycle.
Example 2: Stock B’s Reversal
Stock B reached a major swing high on July 10th, 2022, after a prolonged bull run. By counting forward 144 days, we arrive at December 1st, 2022. As December approached, the stock showed signs of exhaustion, with decreasing volume and bearish technical indicators.
On December 3rd, the stock broke below key support, signaling the beginning of a new downtrend. Traders who were aware of the 144-day cycle could have anticipated this reversal and positioned themselves accordingly.
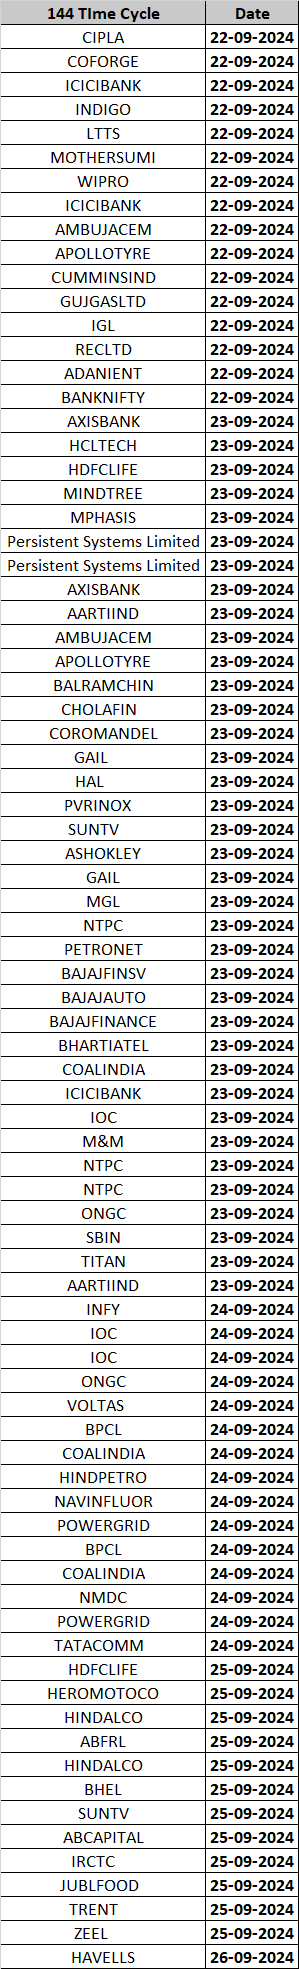
Stocks coming as part of 144 days in coming Week are shown below as part of Gann Time Cycle Scanner
Gann Indicators – TradingView
Common Pitfalls and How to Avoid Them
While Gann’s Price Time Squaring formula and the 144-day cycle can be powerful tools, they are not without their challenges. Here are a few common pitfalls traders encounter when applying these methods, and how to avoid them:
1. Over-Reliance on One Cycle
While the 144-day cycle is important, it’s crucial not to rely solely on this cycle for your trading decisions. Gann himself emphasized the importance of multiple cycles and tools. Combine the 144-day cycle with other indicators, such as moving averages, oscillators, or Fibonacci retracements, to increase your chances of success.
2. Ignoring Market Conditions
The 144-day cycle should be used in conjunction with broader market analysis. If the market is experiencing extreme volatility or macroeconomic factors are influencing price action, the cycle may not play out as expected. Always be mindful of the larger context when applying Gann’s methods.
3. Failing to Confirm with Price Action
One of the biggest mistakes traders make is blindly following the cycle without confirming the breakout or reversal with price action. Even if the 144-day mark is approaching, it’s essential to wait for clear signs in the chart, such as a breakout above resistance, increasing volume, or bullish candlestick patterns.
Conclusion: Harnessing the Power of Gann’s 144-Day Cycle for Big Stock Breakouts
W.D. Gann’s Price Time Squaring formula and the 144-day cycle offer a unique and powerful approach to predicting big moves in the stock market. By aligning price and time, and by understanding the cyclical nature of markets, traders can gain a significant edge in anticipating breakouts and reversals.
While Gann’s methods require patience and practice, the rewards can be substantial for those willing to master them. As with any trading strategy, it’s important to combine Gann’s tools with other forms of analysis, maintain proper risk management, and stay disciplined in your approach.
By incorporating the 144-day cycle into your trading toolkit, you’ll be better positioned to capture the big moves that can make all the difference in your stock market success.
Start applying Gann’s 144-day cycle today and unlock the potential for predicting major stock breakouts. With the right combination of timing, price analysis, and discipline, you can harness the power of Gann’s methods to take your trading to the next level.