SENSEX saw the first weekly decline of 0.5% after 08 weeks of rise, Coming week Mercury is going Retrograde and Venus in Virgo Zodiac both being inner plannet can lead to big move.
Astro analysis can help identify trends and reversals in the market, and it can be used in combination with other technical analysis methods to improve the accuracy of trading strategies. Gann analysis involves studying charts and identifying support and resistance levels to pinpoint potential trading opportunities.
SENSEX Harmonic Pattern
SHARK Pattern is forming with price can fall towards 80670-80326 till below 81400.
SENSEX Gann Angles
Price started the fall from Gann Angle Resistance zone.
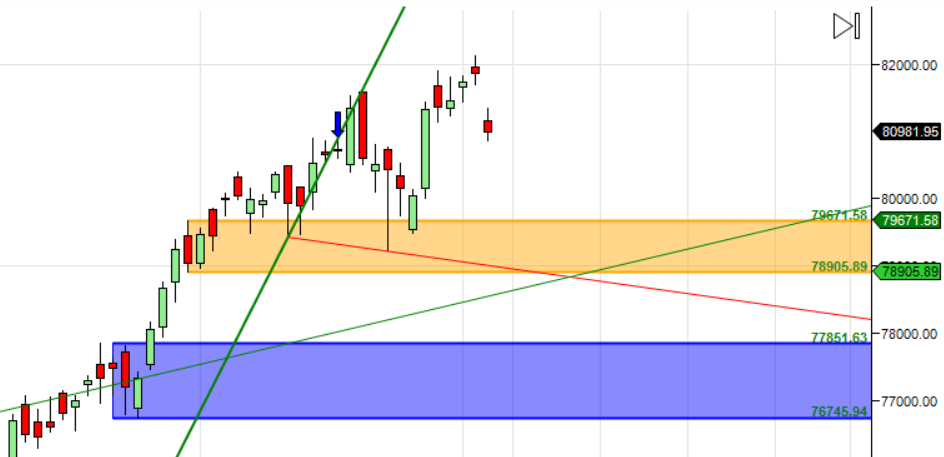
SENSEX Supply and Demand
Self Explanatory Chart
SENSEX Time Analysis Pressure Dates
05/08 Aug is the Important Gann/Astro Date for coming week.
SENSEX Weekly Chart
Price reacted from its AF Resistance zone.
SENSEX Monthly Charts
82775 is Monthly resistance zone 79839 is Support zone.


