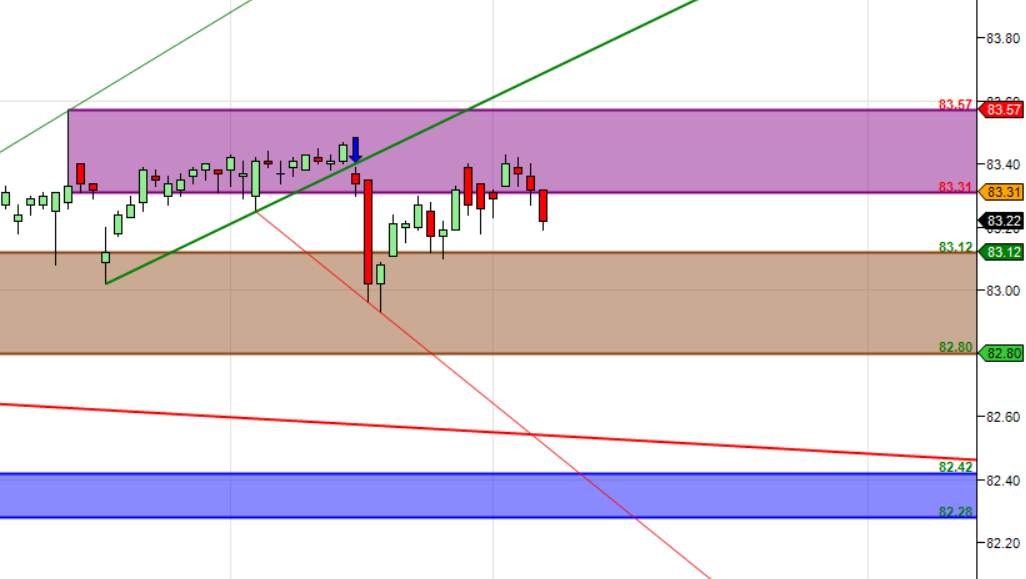
The USDINR market has remained in a persistent stalemate since August of the previous year, with a tight trading range between 82.80 and 83.40. This range is primarily concentrated within the 83.00 to 83.35 levels, lasting over five months with fluctuations of less than half a rupee. Such a stable period may inadvertently lead hedgers and option sellers to become complacent. Traders might assume that this current stability is a lasting norm, possibly attributing it to the apparent control exerted by the Reserve Bank of India (RBI) over daily trading activities. However, it’s crucial to recognize that this calm may be deceptive. The RBI could be strategically managing relative volatility and the Rupee’s performance. Despite being the least volatile USD pair in the tumultuous global market conditions of 2022, USDINR surged by over 10 rupees in a couple of quarters. In contrast, in the past 12 months, amidst a worldwide collapse in average volatility, USDINR seems to have entered a phase of minimal volatility. There’s a looming prospect of a reversal in the global volatility cycle. When it shifts from a downward trend to an upward one, USDINR is likely to experience heightened volatility. Currently, traders might consider adopting a strategy of buying the dip near the 83.00/8310 levels with a stop loss below 83.00 on a closing basis. On the flip side, the upside potential seems limited, with resistance expected around the 83.50 spot levels.
USD INR GANN Chart

USD INR back to gann angle support zone.
USD INR Supply Demand Zone

India Rupee Supply Demand Chart : Demand in range of 82.75-82.80, Supply in range of 83.15-83.230
USD INR Harmonic
Price is forming the D Leg of SHARK Pattern heading towards 82.80 till below 83.25

