


The Reserve Bank of India (RBI) appears to be clearly indicating its intention to prevent the currency from surging above the previous all-time high, which varies between 83.25 and 83.30,Simultaneously, there is a notable increase in open interest around the 83.00 strike put option, suggesting that traders may be speculating on the USDINR maintaining levels above 82.90/83.00 for the foreseeable future.
USD INR Weekly Chart
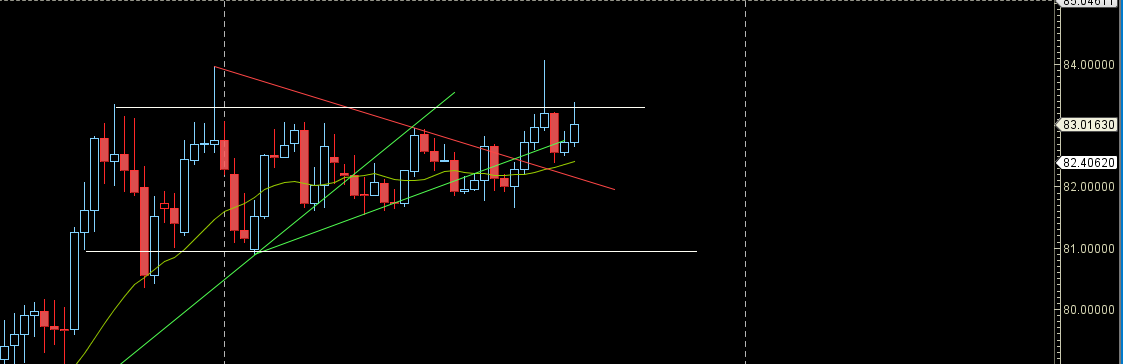
USD INR rejected from Upper end of range one again.
USD INR Plannetary Support and Resistance Line

Indain Rupee is middle zone of Venus Plannets line.
USD INR Harmonic

Price has completd the Deep Crab Pattern if 82.5 is held price is heading towards 84 new all time high.