


In Continuation with previous Article Introduction to Camarilla Pivot Points
How to trade using Camarilla Pivot Points
As we have discussed How to generate Camarilla Pivot points now let’s discuss how can we trade using them.
- Price Opens at/Between Support 3 and Resitance3: When the Price Opens between S3(Support 3) and R3 (Resistance 3)we will use the following Rule to take trades
- For Long/Buy Trades: Let the price move till S3,once it reaches S3 take long trade with Stop loss placed below S4 Target for trades are R1,R2 and R3.
- For Short/Sell Trades: Let the price move till R3,Once it reaches R3 take short trade with Stop Loss placed above R4 Target for Trades are S1,S2 and S3.
Lets take one for Example of S&P 500
On 14th Feb 2012 $SPX has the following OHLC values
Open = 1351.30 High=1351.30 Low =1340.83 Close =1350.50 Let’s use this value in the above formulae to generate the Resistance and Support levels.
R1 = 1351.46 R2 = 1352.42 R3 =1353.38 R4 = 1356.26
S1 = 1349.54 S2 = 1348.58 S3 = 1347.62 S4 = 1344.74
Now for 15th Feb Trade Strategy will be to
- Buy at S3 ie. 1347.62 With Sl below S4 ie. 1344.69 Target 1351.46.1352.42 and 1353.38
- Sell at R3 ie. 1353.38 With Sl above R4 ie. 1356.31 Target 1349.54,1348.58 and 1347.62
Let’s see how the trades triggered on 15th Feb. S&P opens at 1350.52 which is between S3 and R3. Trade got triggered as per our plan at 11:15 and after that S&P makes high of 1355.87 which is below our Sl. Target for the trade gets achieved at 14:00.

- Price Opens in between Resistance 3 and Resistance 4:
- Long trades will be taken with Buy above Resistance 4 Tgt Resistance 5 and Resistance 6 Sl Resistance 3
Let’s elaborate taking an example of Apple stock trade on 14th Feb 2012
On 13th Feb 2012 AAPL has the following OHLC values
Open = 499.74 High=503.83 Low =497.09 Close =502.6 let’s use this value in the above formulae to generate the Resistance levels.
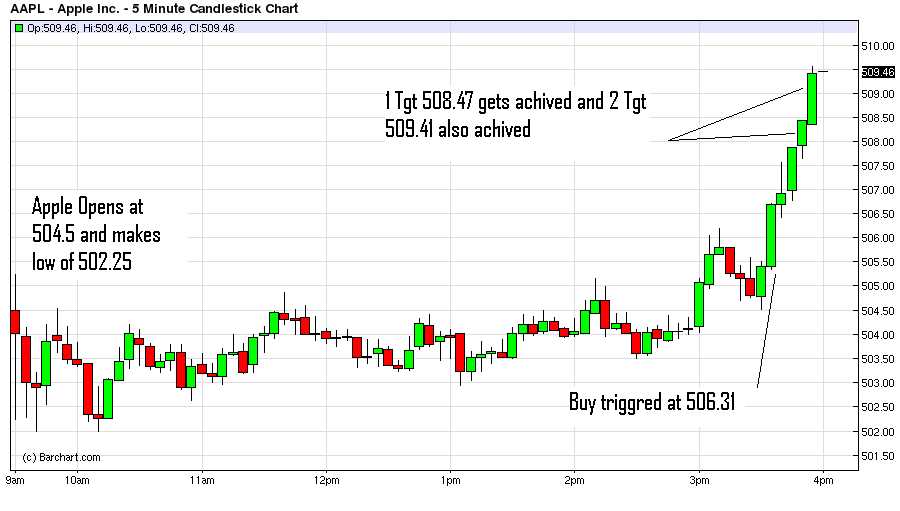
R3 =504.45 R4 = 506.31 R5 =508.47 and R6 = 509.41
Now for 14th Feb Trade Strategy will be if Price opens between R3 and R4
- Buy at R4 ie. 506.31 with Sl below R3 ie. 504.40 Target 508.47 and 509.41
Let’s see how the trades triggered on 14th Feb. Apple opens at 504.5 which is between R3 and R4. Trade got triggered as per our plan at 15:35 and after that Apple achieves the 1 target of 508.47 at 15:50 and 2 target of 509.41 at 15:50 as shown in below chart.
Traders can use this Link to Generate Camarilla Pivot Points http://pivotpointscalculator.blogspot.in/
To conclude, Camarilla Pivot Points help to find the upper and lower trading range for the stock for any particular day. Traders using Camarilla should have timing and patience for the price to reach the Buy and Sell zone. Camarilla used with RSI and moving average will give an edge to professional traders to get the most out
Camarilla used with RSI and moving average will give an edge to professional traders to get the most out .(BHRAMESHJI CAN YOU PLEASE ELABORATE)
REGARDS
Sanjay