Larry Williams OOPS System methodology was presented in his book, How I Made One Million Dollars Trading Commodities. It is still used by many traders with varying adaptations. OOPS trading System can be used for pattern applicable on hourly, daily, weekly, monthly or yearly.
History:
Back in 1979 Larry Williams published a description of a short-term trading method that is based on a pattern observed often in markets. The OOPS signal is a gap trading method that fades the direction of the opening gap. It is named thus, according to Williams, because when a broker would report to his clients that they were stopped out, he would call them and say, “Oops, we lost.” Markets open and gap overnight, due to a reaction stemming from a news announcement or event occurrence. The gap is based on the opinions that are formed by the crowd, “savvy” traders, and active players in that market. After the open, traders could realize that the market’s price had overreacted from the initial event, which caused the market to create the gap in the first place. The favorable outcome for the OOPS to work occurs as traders reevaluate the impact that the news or event had on the market’s price. Prices then reverse and move back in the opposite direction of the gap.
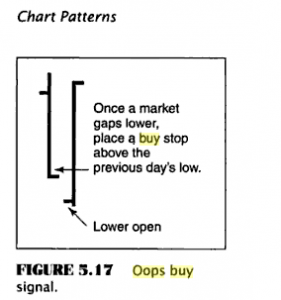
OOPS BUY
a) If you are watching daily charts, the first condition is that there has to be a SUSTAINED downtrend for a few trading sessions.I mean few Red Candles on daily Charts
b)On the last day of downtrend when the Oops buy occurs, there is a gap down, which opens well below the previous day’s low.
c)During the course of trading the stock rises and goes above the previous day’s low, and also the previous day’s close.
The above 3 steps if occurs generates an OOPS buy, with a stop loss of that day’s low.
Example:

As per the Chart Shown above all OOPS Steps are applied and We can see Gasim Rallying to almost 10% from the OOPS Buy Generated.
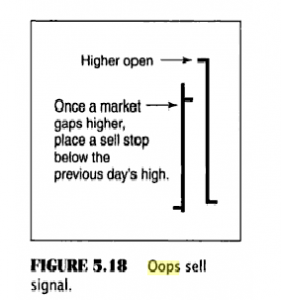
OOPS Sell
a) If you are watching daily charts, the first condition is that there has to be a SUSTAINED Uptrend for a few trading sessions.I mean few white Candles on daily Charts
b)On the last day of uptrend when the Oops sell occurs, there is a gap up opening, which opens well above the previous day’s high.
c)During the course of trading the stock corrects and goes below the previous day’s high, and also the previous day’s close.
The above 3 steps if occurs generates an OOPS sell, with a stop loss at day’s high.
The pattern has its validity and its statistical value. Using OOPS, you can get significant gains from fading the gap. Often, when the trade goes in your direction, you have a trend day with nice profits. results of the pattern depend at least on money management and stop-loss rules. However, it is not a mechanical system. You can have fun trying to figure out in which conditions OOPS works best.


OOPs …. Its really an OOPs idea