Last week we gave Chopad Levels of 7820 , Nifty gave long entry on Monday opening and rewarded the Chopad followers by doing 2 target on upside.Also gave shorting opputunity and rewarded traders with 1 Tgt on downside. Our Prayers for the families who have suffered from the Paris attack.Lets analyze how to trade market in coming week.
Nifty Hourly Chart

As we discussed last week Nifty hourly chart continues to trade below the 21/34ema line, support is now at 7819/7767 range,till close is not above 21/34 ema its sell on rise market.
Nifty touched 34 ema on monday was unable to close above it and continued with its correction.Strong support in range of 7700/7681 holding the same bounce back can be expected.
Nifty Harmonic

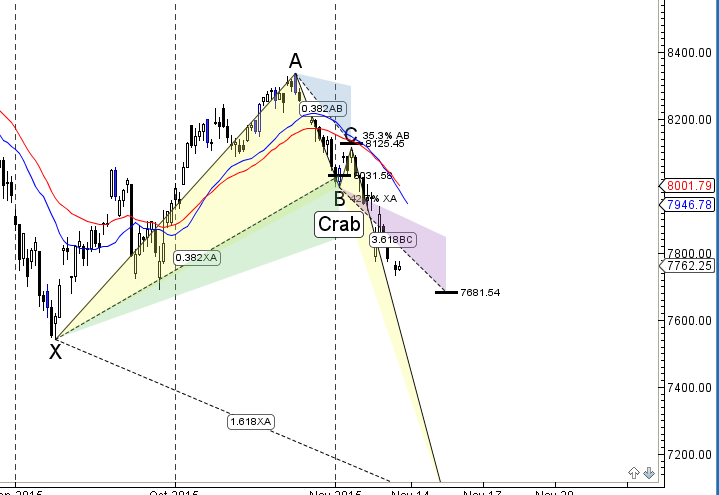
As we discussed last week As per Harmonic shark pattern 7783 is the logical target of the downmove.
Nifty made low of 7772 on monday opening before bouncing back, 7681 is another logical target as per harmonic pattern.
Nifty Gann Angles

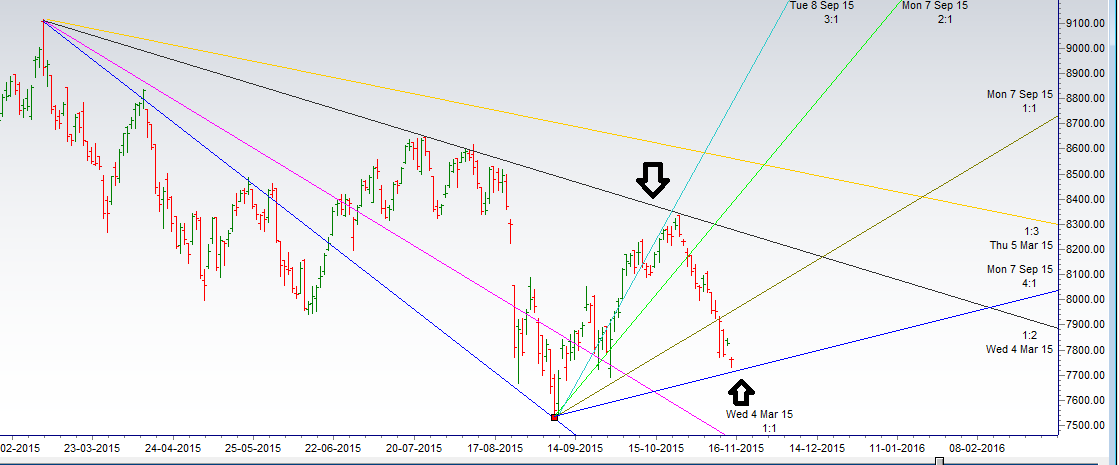
As discussed last week Nifty gann angles showed the price time square as market was not able to break 8329 odd levels suggesting we have formed short term top and can fall all the way till 7938 odd levels if 8008 does not hold.7938 is achieved now next logical target should be 7810 which should be done in todays gap down and after that 7750.
Nifty of the blue line holds can see fast and furious rally till 7830/7950 odd levels.
Nifty Supply and Demand

Self explanatory chart of Supply and Demand zone.
Nifty Gann Date
Nifty As per time analysis 16/20 Nov is Gann Turn date , except a impulsive around this dates. Last week we gave 09 Nov Nifty saw a volatile move . Effect of Aniversary date will be shown at market opening.
Nifty Gaps
For Nifty traders who follow gap trading there are 15 trade gaps in the range of 7000-9000
- 7067-7014
- 7130-7121
- 7276-7293
- 7229-7239
- 7454-7459
- 7775-7825
- 7950-8005
- 8327-8372
- 8937-8891
- 8251-8241
- 8232-8209
- 8116-8130
Fibonacci technique
Fibonacci Retracement

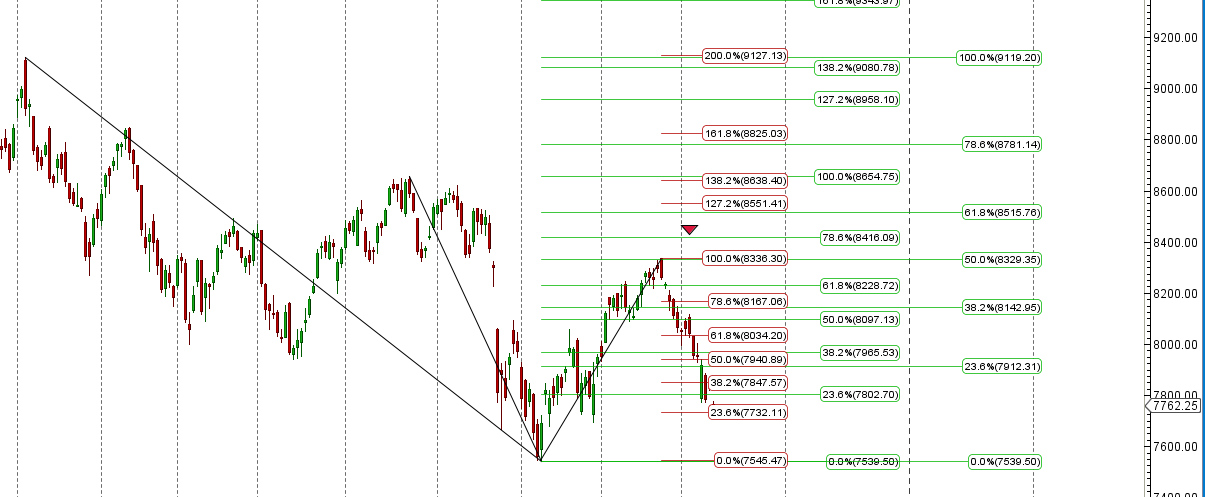
7802/7732/7847/7912 are levels to be watched in coming week.
Nifty Weekly Chart


It was negative week, with the Nifty down by 192 points closing @7762 continued with its fall and closing below its 20 WEMA and 55 WEMA and took support at 100 WEMA .100 WEMA has supported last 4 time, WIll it hold 5 time ? Nifty continues to trade in its weekly channel Time Analysis is approaching new cycle in coming week.

Trading Monthly charts

Monthly chart took support @61.8% retracement line and showed bounce back and unable to cross 78.6% retracement.
Nifty PE

Nifty PE @20.97 , valuation has taken a beating as most of results have been inline or below expectation.
Nifty Weekly Chopad Levels
Nifty Trend Deciding Level:7820
Nifty Resistance:7881,7930,8017
Nifty Support:7681,7603,7540
Levels mentioned are Nifty Spot
Let me go by Disclaimer these are my personal views and trade taken on these observation should be traded with strict Sl.Please also read the detailed Disclaimer mentioned in the Right side of Blog.
Want to see post in your Inbox,Register by adding your email id in Post in your Inbox section
Follow on Facebook during Market Hours: https://www.facebook.com/pages/Brameshs-Tech/140117182685863

What is the new time cycle.
Thanks for great analysis it helps us thanks sirji
sir , as we are entering a new time cycle. what does it indicate ~ bull or bear time cycle?
good job sir & thank you for your wonderful analysis.
Thanks ALl !!
Sir, weekly chopped levels are same ase previous week……
It is correct or something wrongly post?
Thank you……
Its correct !!