Last week we gave Chopad Levels of 8335 , Nifty opened at 8333 made high of 8336 give a very good entry to Chopad DISCIPLINED followers and all 3 targets were done on downside. Lets analyze how to trade market in coming week. Traders do remember Lot size revision will take place from November Expiry and Nifty Lot size is revised to 75, For more details please read this
Nifty Hourly Chart

Nifty hourly chart reacted from the 8336 resistance zone and is heading towards the support of 8005 and 7940 if 8100 is not broken by bulls.
Nifty Range

8298 on Upside and 7943 on Downside is the range of market for time being.
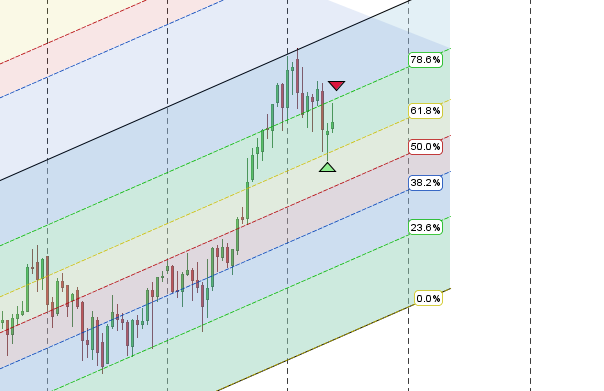
Nifty Gann Box

Nifty gann angles showed the price time square as market was not able to break 8329 odd levels suggesting we have formed short term top and can fall all the way till 7938 odd levels if 8008 does not hold.
Nifty Supply and Demand

Self explanatory chart of Supply and Demand zone.
Nifty Gann Date
Nifty As per time analysis 03 Nov is Gann Turn date , except a impulsive around this dates. Last week we gave 28 Oct Nifty saw a volatile move . 07 Nov should also be watched as its Gann emblem date and also coinciding with Anniversary date.

Nifty Gaps
For Nifty traders who follow gap trading there are 15 trade gaps in the range of 7000-9000
- 7067-7014
- 7130-7121
- 7276-7293
- 7229-7239
- 7454-7459
- 7950-8005
- 8327-8372
- 8937-8891
- 8251-8241
- 8232-8209
- 8107-8130
- 7950-8005
Fibonacci technique
Fibonacci Retracement

Got resisted 50% @8328 next zone of Support @7965

Got resisted at Fibo Base line and falling towards the support zone will it hold ? discussed last week.
Nifty Weekly Chart


It was negative week, with the Nifty down by 229 points closing @8065 forming a bearish engulfing pattern and closing below its 20 WEMA and 55 WEMA . As discussed last week Nifty is also heading towards the upper end of channel as shown in 1 chart closing above channel will be bullish unable to do so can move down to channel bottom in medium term. Time Analysis is approaching the last cycle this week, it has been a neutral cycle.

Trading Monthly charts

Monthly chart took support @61.8% retracement line and showed bounce back and unable to cross 78.6% retracement.
Nifty PE

Nifty PE @22.06 , entering the result season with expensive valuation.Most of results have been inline or below expectation.
Nifty Weekly Chopad Levels
Nifty Trend Deciding Level:8044
Nifty Resistance:8145,8210,8253
Nifty Support:8000,7943,7856
Levels mentioned are Nifty Spot
Let me go by Disclaimer these are my personal views and trade taken on these observation should be traded with strict Sl.Please also read the detailed Disclaimer mentioned in the Right side of Blog.
Want to see post in your Inbox,Register by adding your email id in Post in your Inbox section
Follow on Facebook during Market Hours: https://www.facebook.com/pages/Brameshs-Tech/140117182685863

bramesh ji, what is that anniversary date?
Day When Nifty was Born
Hello bramesh ji,
Last time I had asked the trading rules regarding entry and exit as well as till what time we should wait to trade. Can please send me a link or elaborate on this fact.
Adityaji
please read this
http://www.brameshtechanalysis.com/2014/08/how-to-trade-intraday-and-positional-calls/
sirji 7 nov is Saturday so should be expect Gann emblem date on 9 nov as on that result of election is also declared..
06 NOv or 9 Nov
Hi ,
Can you include Ichimoku Cloud Tool in your analysis
will try
Sir thanks for you tec analysis,
What is the best time frame for day trading . 1 hour or 4 hour…In gold and silver i use 4 hour time frame for shorter trend….that is for day intraday…
Depends on which strategy your following and your knack in trading
[8142- 8059] [8035- 7995] 7972
Nifty was unable to touch 200DMA at 8380 spot lvl inspite of positive global cues from Europe and china.Nifty has given conflicting signals by making H&S pattern on weekly charts and Inverse H&S pattern on daily charts.Now it seems weekly time frame has took centre stage again and closing below 7925 spot levels Nifty can give steep fall and can remain in downtrend for next one quarter.
Thanks for the detailed analysis. I think the critical support for the market was at the 20 WMA near 8220, once that was taken out the down trend has resumed, the 20 wma should act as resistance on any oversold bounces. Earnings have been weak and an unfavorable Bihar loss for the BJP could trigger a further sell off.
Hello Brameshji…
I always inspired by the first chart…hourly one with 21-34 ema…
Can we make it trading system…?
Means buy when 21ema cross 34ema and sell vice versa?
If yes what should be proper sl…last swing high/low?
Thanks in advance…
Sirji thanks for analysis its really help us thanks again