Last week we gave Chopad Levels of 8026 , Nifty made high of 8043 giving entry to Chopad Follower and achieved all 3 target on downside. Lets analyze how to trade market in coming week.
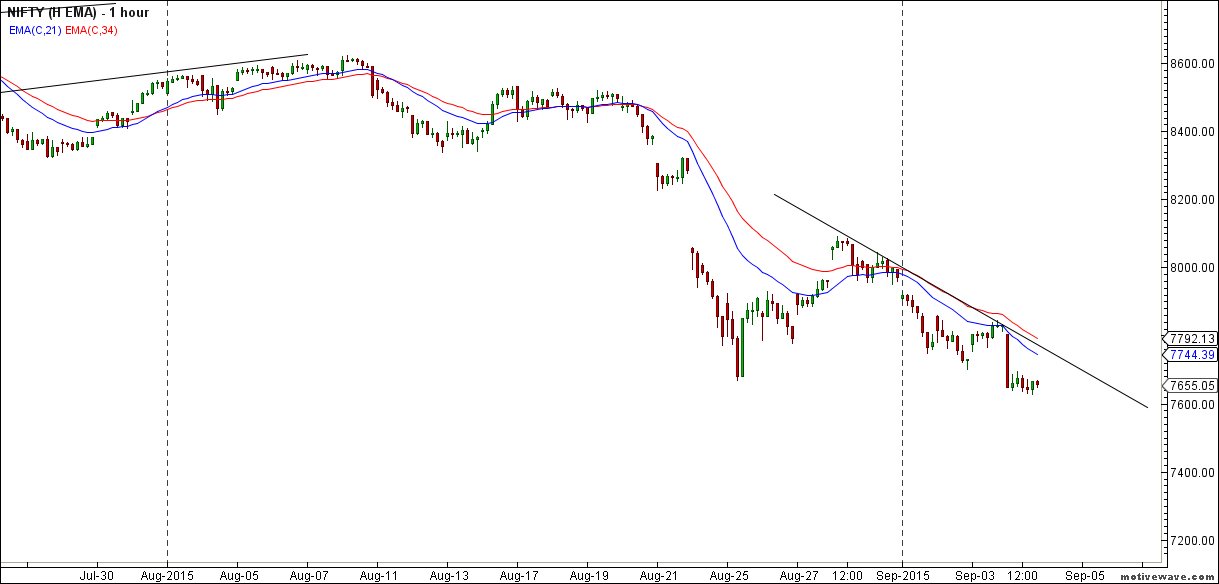
Nifty Hourly Chart

Nifty hourly chart is in downtrend and till it do not close above 21/34 EMA use rallies to short.
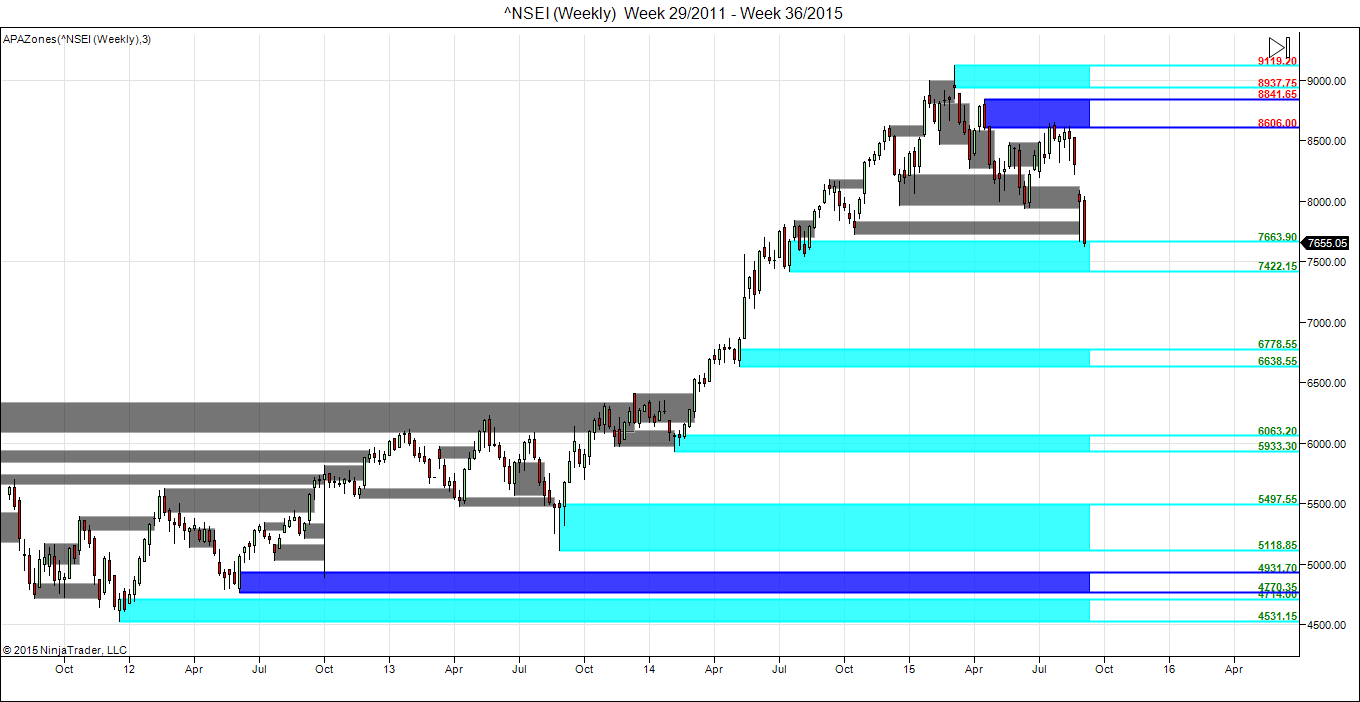
Nifty Supply and Demand

Unable to close above 7663 for 2 days high probablity of nifty hitting 7563/7422.
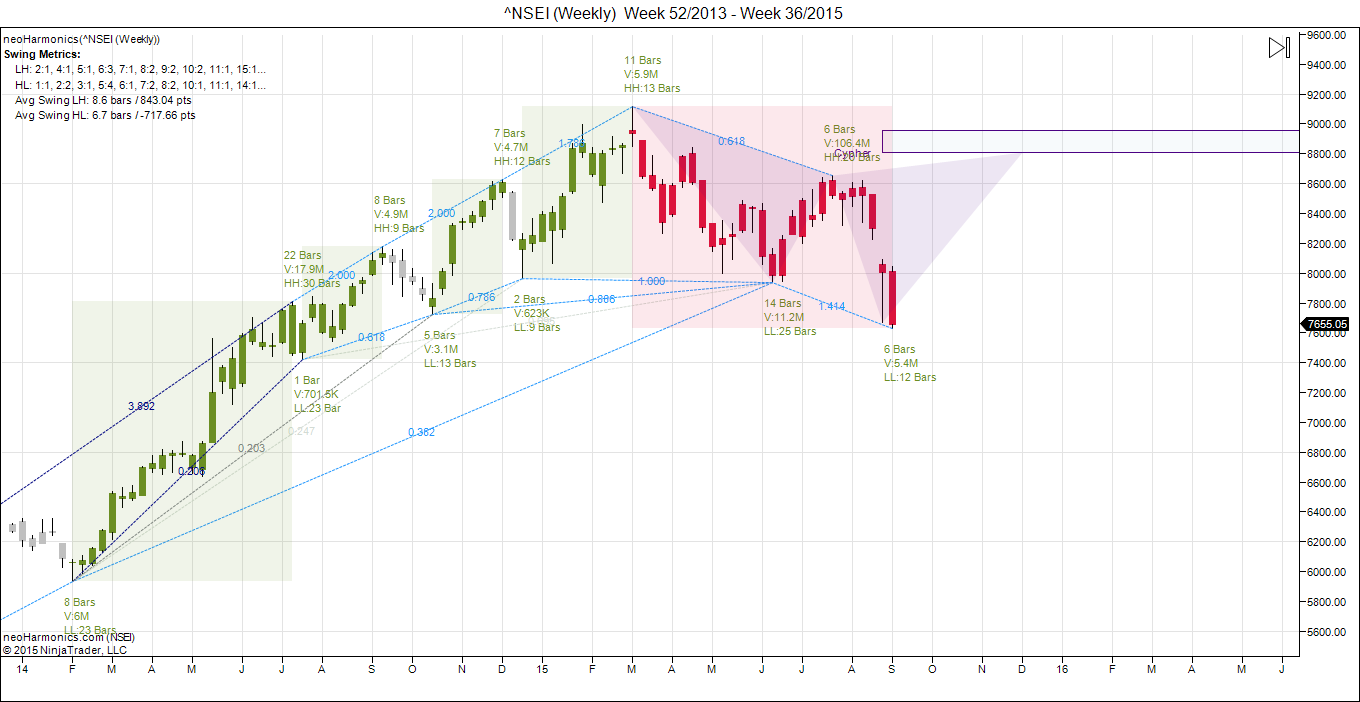
Nifty Harmonic Analysis

Nifty as per Harmonic Analysis has formed Butterfly pattern if 7563/7550 is held nifty can boucne back to 7900/8000 odd levels.
Nifty Gann Date
Nifty As per time analysis 08 September/10 Sep is Gann Turn date , except a impulsive around this dates. Last week we gave 31 August/04 September Nifty saw a volatile move .
Nifty Gaps
For Nifty traders who follow gap trading there are 15 trade gaps in the range of 7000-9000
- 7067-7014
- 7130-7121
- 7276-7293
- 7229-7239
- 7454-7459
- 7526-7532
- 7598-7568
- 7625-7654
- 7780-7856
- 7927-7940
- 8174-8195
- 8091-8102
- 8322-8372
- 8355-8381
- 8937-8891
- 7971-7930
Fibonacci technique
Fibonacci Retracement

7587 is 61.8% retracement /7563 16 May High should be watched in coming week.
Nifty Weekly Chart

It was worst negative week, with the Nifty down by 346 points closing @7995 forming bearish engulfing candlestick pattern , and closing below its 55 WEMA and 20 WEMA and held its trendline support as shown in above chart. We are still in Bullish time cycle from 14 June till mid September, correction in between should be bought into with proper risk management. Entering a new time cycle from 15 Sep and dips coming through should be bought into in scattered manner for investors.

Trading Monthly charts

Monthly chart took support @50% retracement line and showed bounce back.
Nifty PE

Nifty PE @21.21 , so at last seeing some correction in valuation
Nifty Weekly Chopad Levels
Nifty Trend Deciding Level:7563
Nifty Resistance:7636,7700,7775
Nifty Support:7506,7422,7358
Levels mentioned are Nifty Spot
Let me go by Disclaimer these are my personal views and trade taken on these observation should be traded with strict Sl.Please also read the detailed Disclaimer mentioned in the Right side of Blog.
Want to see post in your Inbox,Register by adding your email id in Post in your Inbox section
Follow on Facebook during Market Hours: https://www.facebook.com/pages/Brameshs-Tech/140117182685863

Time Cycle is not for traders taking excessive leverage and trading blindly its for investors who trade in cash market and use this correction to enter the stocks for gains in long term.
Rgds,
Bramesh
(Y) great ty
On 13th of this month there is new moon. So according to moon cycle down trend days are from new moon to full moon.
“Entering a new time cycle from 15 Sep and dips coming through should be bought into in scattered manner for investors.”
What is the meaning for the above? after 15 Sep, is it market going to go up?
As an investor we use positive time cycle to enter stocks for long term gains.
Rgds,
Bramesh
Nifty given breakout on weekly head and shoulder pattern with closing below 7940 on weekly basis.Now tgt for this pattern comes out at 7000 nifty spot levels. Tgt should get completed max. by November series. But H&S pattern also gives one sharp pullback. If nifty spot after kissing 7500 level don’t close below it then high probability of nifty going towards 7940 levels.
Fantastic graphs and neat explanation, it will be great if views and opinion and description also given.
When friday will black then monday will b black monday nifty now entor in crection jone from high its creckt 23% 7014 gap can fill in septembr so cosess advise not to bottem fising buy put 7500 for tgt 7420 7220 7020