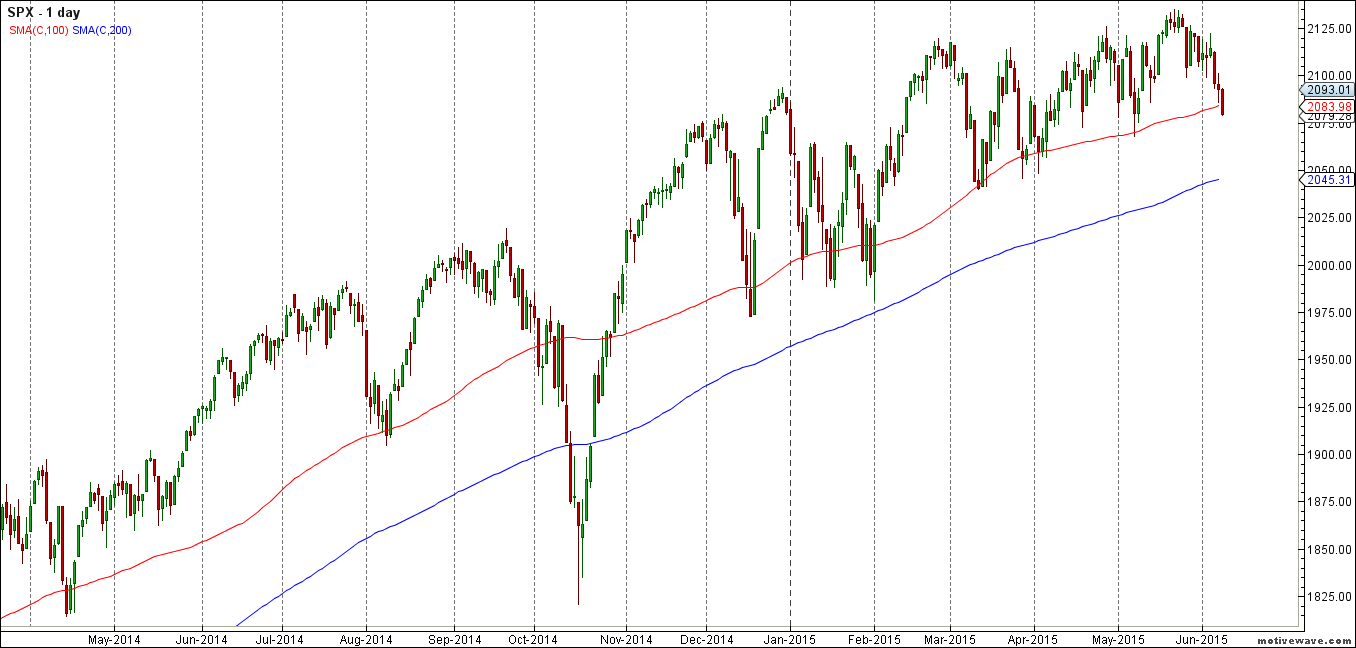
Over the past 3 years, the only support level that has mattered for the S&P500 was the 100 Day Moving Average: every single time the S&P has approached, or breached, this trendline, the result has been a bout of buying pushing it right above, and keeping it in the clearly visible upward channel since 2012.

As BofA notes, since 2012, corrective declines have based in the area of the 100 DMA with 2 exceptions. The bank adds that while it hopes the selling stabilizes around the 100 DMA, “a sustained break below the 100 DMA would expose the 200D at 2045.85 before renewed basing potential. Back above the 2121.92 high high says the correction is over, with a break of 2134.72 confirming a resumption of the long term uptrend.”
BofA is bullish, and expects the S&P to target 2,200/2,250. We, on the other hand, are less so, especially since as noted over the weekend, last week we just saw a massive, 28-year upward trendline breached for the first time in Exxon Mobil stock, the world’s second largest company by market cap.
The S&P may be next.


