


Last week we gave Chopad Levels of 8595 ,did all 3 target on downside and breaking its 100 DMA. Lets analyze how to trade last week of financial year.
Nifty Hourly Chart
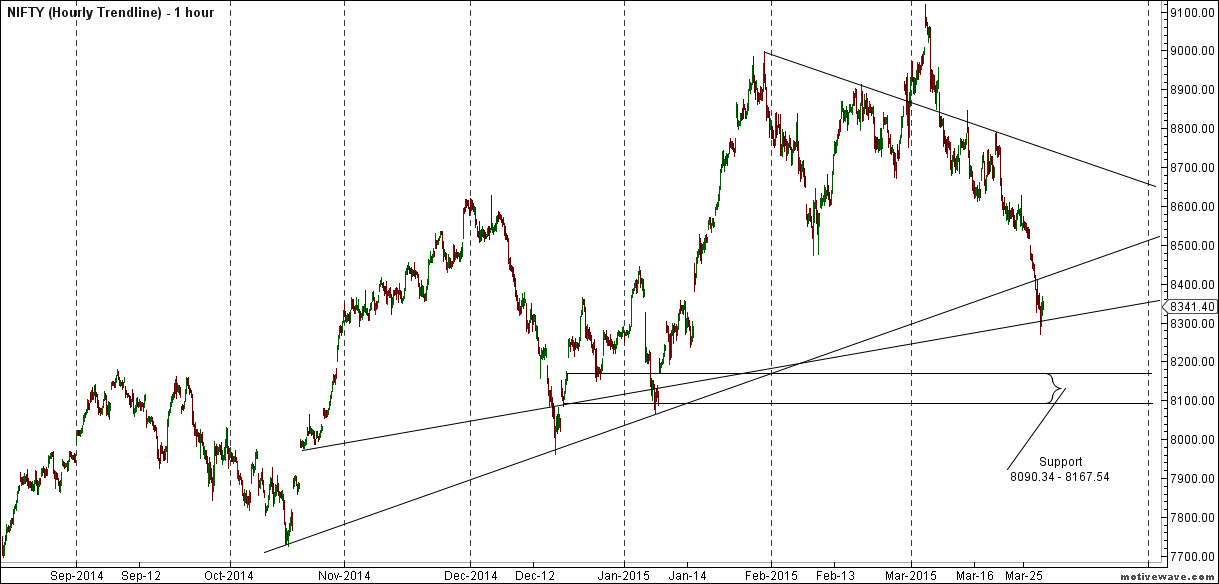
Nifty Hourly charts is near its trendline support and trading well below 21/34 EMA, any break of 8269 can lead nifty down further downfall in demand zone of 8167-8094 as shown in above chart.
Nifty Hourly Elliot Wave Chart
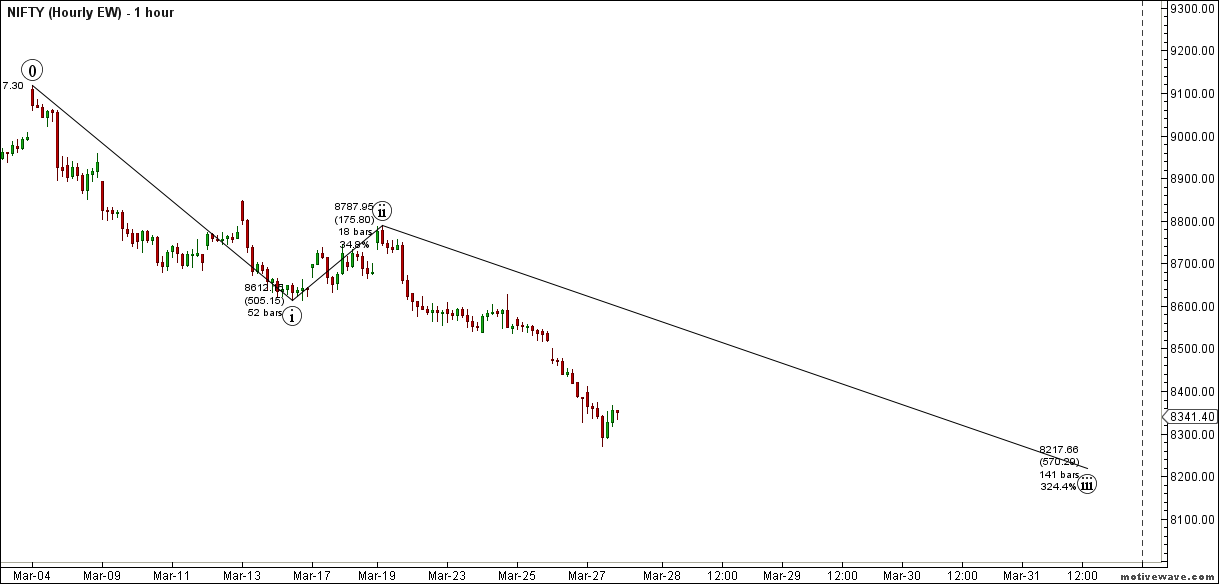
8269 will play a vital role in coming week, close below can see 8167/8090 range. Holding the same can see nifty moving towards 8470 odd levels.
Nifty Pyrapoint Analysis

As per Pyrapoint Analysis close above 8383 is required for short term reversal as its 225 degree line.
Nifty Market Profile

This is what we discussed last week Coming week 8605 should be watched closing above it 8650/8746 are short term target. Nifty moved above 8061 but was unable to close above it and saw the big fall.
Coming week 8317 should be watched, holding the same we can see pullback rally. Unable to close above it can see Nifty moving towards 8167/8090 odd levels.
Nifty Daily

Nifty after 3 attempt in past has broken its trendline support zone and its 100 DMA, after almost 10 months. Also going near its 200 DMA, Last time nifty touched its 200 DMA on 04 Feb 2014.
Nifty Gunner

ON Daily chart Nifty Gunner is still few 100 points away from its Sell target so we will get a touch of 200 DMA ?
Nifty Harmonic

Harmonic pattern shows the completion of bearish pattern now waiting for counter trend rally Will Nifty oblize ?
Nifty Daily Elliot Wave Chart
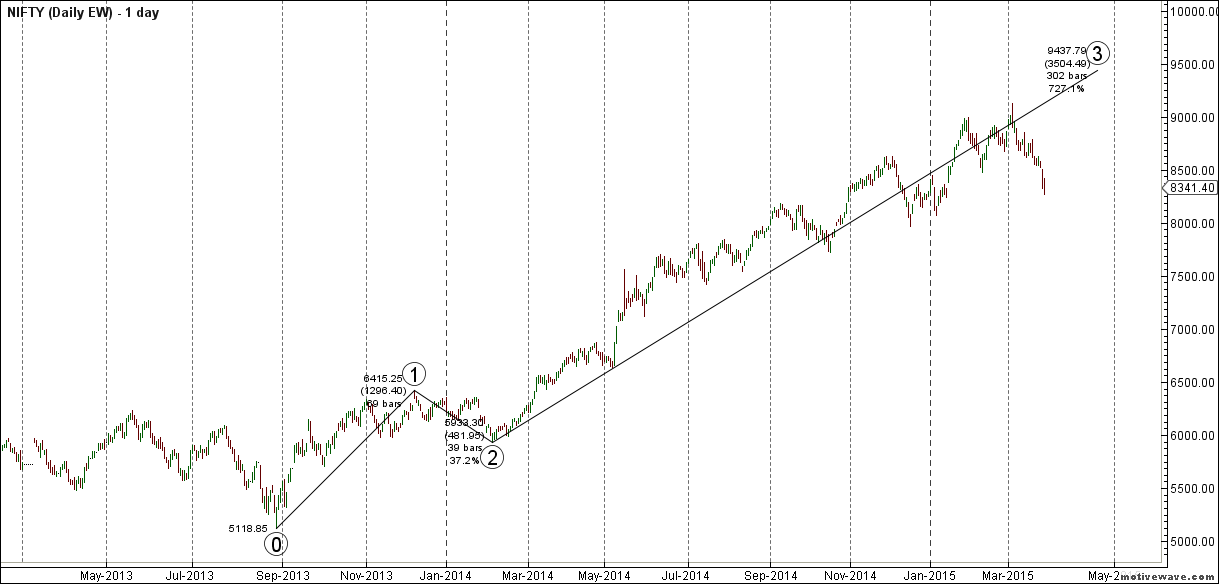
As per EW more legs are left to the rally use dips around 8200/8165 to take exposure to quality large and mid caps stocks. NO leveraged positions this for cash market traders.
Nifty Gann Date
Nifty As per time analysis 31 March/01 April is Gann Turn date , except a impulsive around this dates. Last week we gave 24/27 Mar Day and Nifty saw a volatile move on both the days .24 it created short term top and weekly bottom on 24.
Nifty Gaps
For Nifty traders who follow gap trading there are 14 trade gaps in the range of 7000-9000
- 7067-7014
- 7130-7121
- 7276-7293
- 7229-7239
- 7454-7459
- 7526-7532
- 7598-7568
- 7625-7654
- 7780-7856
- 7927-7974
- 8029-8065
- 8378-8327
- 8102-8167
- 8937-8891
Fibonacci technique
Fibonacci fan
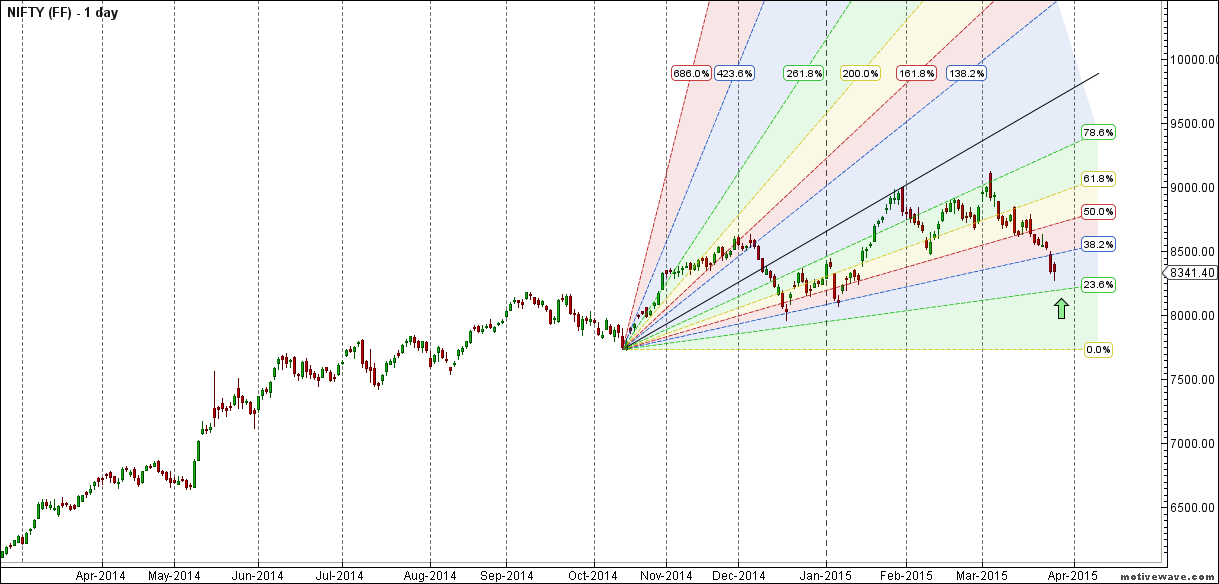
Nifty near its Fibo fan support so next week we need to see do we get the follow up move.

8240 is 23.6% retracement number so keep a eye on downside.
Nifty Weekly Chart
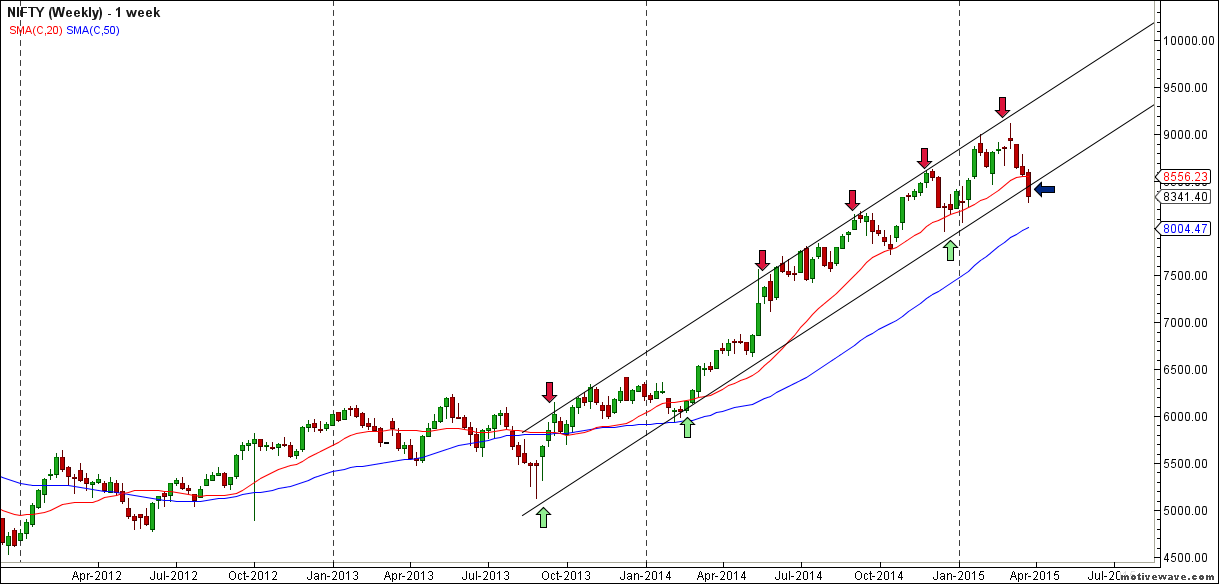
It was negative week, with the Nifty down by 229 points closing @8341 , and broke its 20 WSMA which has given support in past 3 times as seen in above chart and also broke its weekly channel. Also we are entering a new time cycle which will be till 10 April which will be neutral to positive. As per Gunner pattern we are might has formed short term bottom or room for another 100 point fall near 200 DMA.


Trading Monthly charts

Monthly lower trendline support @8200/8156 range.
Nifty PE

As per PE ratio has cooled of to 22.3, We were cautioning readers from past 3 weeks when it touched 24 zone, still we need range for 20-21 for a cool off.
Nifty Weekly Chopad Levels
Nifty Trend Deciding Level:8335
Nifty Resistance:8412,8470,8546
Nifty Support:8286,8237,8156
Levels mentioned are Nifty Spot
Let me go by Disclaimer these are my personal views and trade taken on these observation should be traded with strict Sl.Please also read the detailed Disclaimer mentioned in the Right side of Blog.
Want to see post in your Inbox,Register by adding your email id in Post in your Inbox section
Follow on Facebook during Market Hours: https://www.facebook.com/pages/Brameshs-Tech/140117182685863
hi can i shot nifty april. series now.
Sir, where is the PE chart and data available on the internet
bn spot if sustain above 18740 to 18755 (resistence) is more vittal for bullishness in bn spot and as well as nifty spot–8435 to 8465 more crucial resistence.if bn spot trade above 18740 for 30 minutes then nifty on the upside rally.but it seems to me more bearish in bn and nifty.17400 to 17350 is the next support for bn spot for next week.or financial year end 2015.
AS PER DAILY CHART, I WISH TO CONSIDER MOVEMENT ABOVE 100 DMA TO ENTER LONG AND BELOW 200 DMA TO GO SHORT & BE NEUTRAL IN BETWEEN
THANKS FOR DETAILED CHARTING
good think
” No leveraged position this for cash market traders ”
Do u mean no future positions, this is for cash market only.