


The Japanese began using technical analysis to trade rice in the 17th century. While this early version of technical analysis was different from the US version initiated by Charles Dow around 1900, many of the guiding principles were very similar:
-
The “what” (price action) is more important than the “why” (news, earnings, and so on).
-
All known information is reflected in the price.
-
Buyers and sellers move markets based on expectations and emotions (fear and greed).
-
Markets fluctuate.
-
The actual price may not reflect the underlying value.
According to Steve Nison, candlestick charting first appeared sometime after 1850. Much of the credit for candlestick development and charting goes to a legendary rice trader named Homma from the town of Sakata. It is likely that his original ideas were modified and refined over many years of trading eventually resulting in the system of candlestick charting that we use today.
Remember a basic principle: candlestick charting techniques are a tool and not a system. For example, one must view a candlestick pattern within the context of the surrounding technical picture. Without doing so would be, as the Japanese proverbs says, “Like leaning a ladder against the clouds”
Here are 7 candlestick patterns every trader should know.
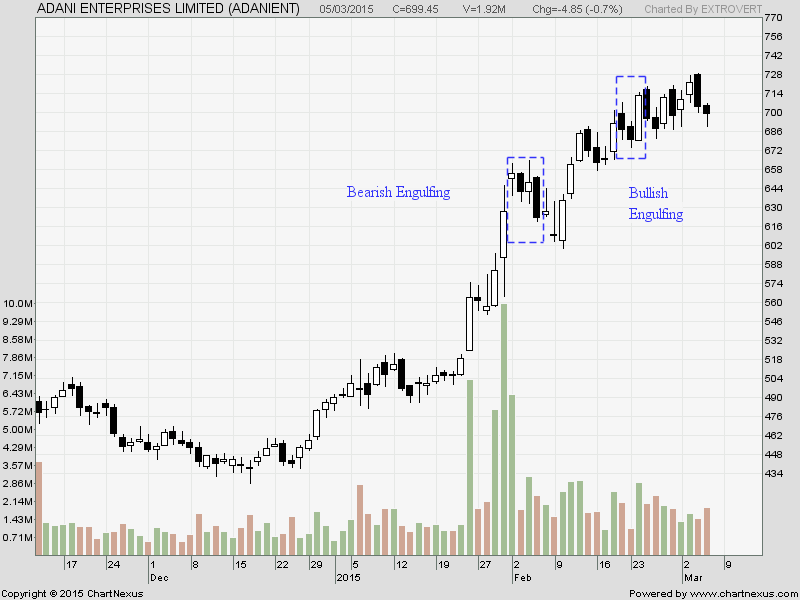
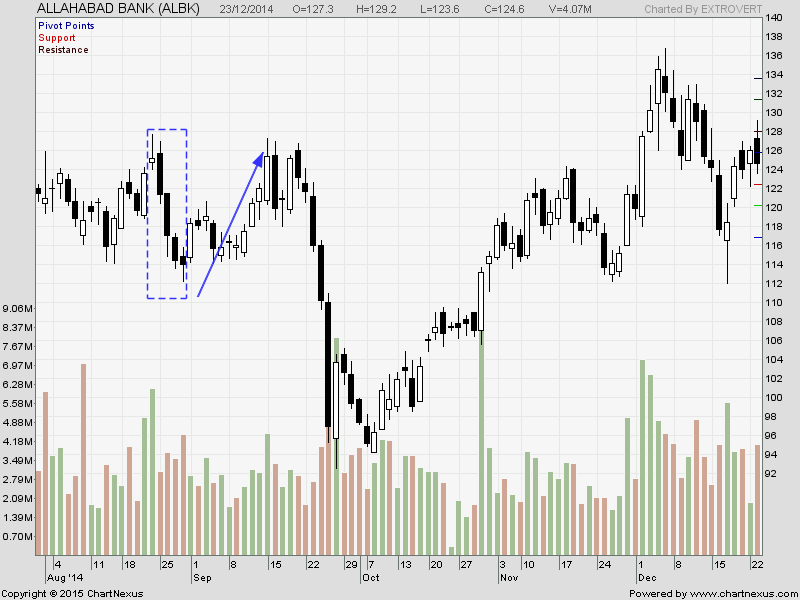
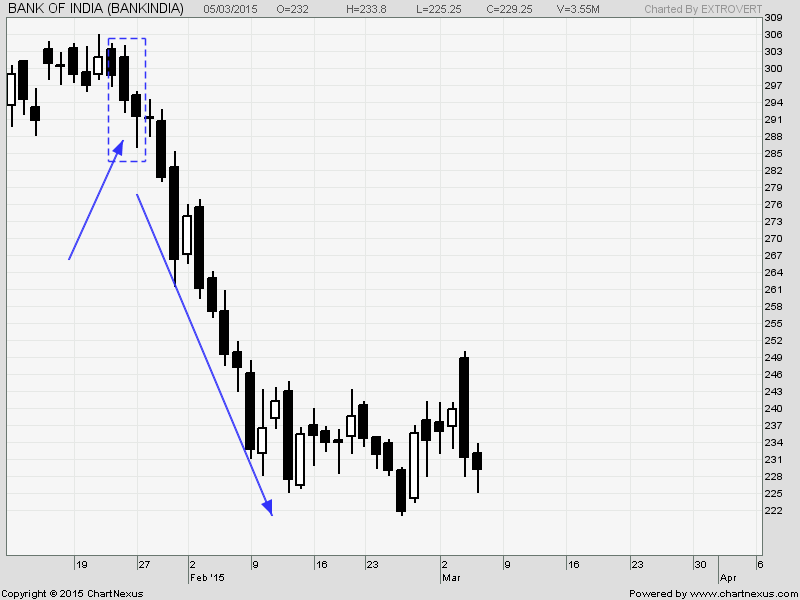
Engulfing
This pattern consists of two candles and a bullish engulfing pattern is when a white real body engulfs (hence the name) a small black real body during a downtrend. It doesn’t mean a stronger rally on a candlestick chart but it does increase the likelihood of that being excellent support and could be the start of an ascent. Be careful. The dual bullish engulfing patterns have nothing to do with how far the market will ascend. These additional support points are a great advantage when candlestick trading.

Hammer
This pattern is an important bottoming candlestick line. The hammer and the hanging man are both the same line. That is a small real body (white or black) at the top of the session’s range and a very long lower shadow with little or no upper shadow. When this line appears during a downtrend it becomes a bullish hammer. For a classic hammer, the lower shadow should be at least twice the height of the real body

Hanging Man
This pattern is an important top reversal. The hanging man and the hammer are both the same type of candlestick line (i.e., a small real body (white or black), with little or no upper shadow, at the top of the session’s range and a very long lower shadow). But when this line appears during an uptrend, it becomes a bearish hanging man. It signals the market has become vulnerable, but there should be bearish confirmation the next session (i.e., a black candlestick session with a lower close or a weaker opening) to signal a top. In principle, the hanging man’s lower shadow should be two or three times the height of the real body.

Exciting
To Be Continued in next article
When are you publishing the next article on this?
We published both articles.
Rgds,
Bramesh
Yes, I also wait for the next week
Sir, i CANNOT SAVE THIS ARTICLE HOW IT CAN BE DONE
Excellent article in nice simple language. Thanks.
Us mkt made a avery barrish candel friday what views on indian mkt
super sir thqs
please explain about icici chart pattern from 28th february,2015
Nice, Waiting for the next article.