


Nifty Hourly Chart
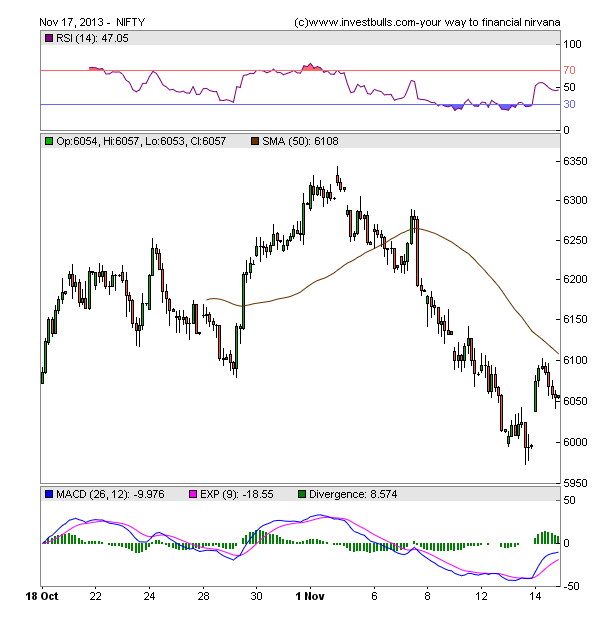
Nifty once it will move above its 50 HSMA,will be good for bulls in short term.
Nifty Daily Chart
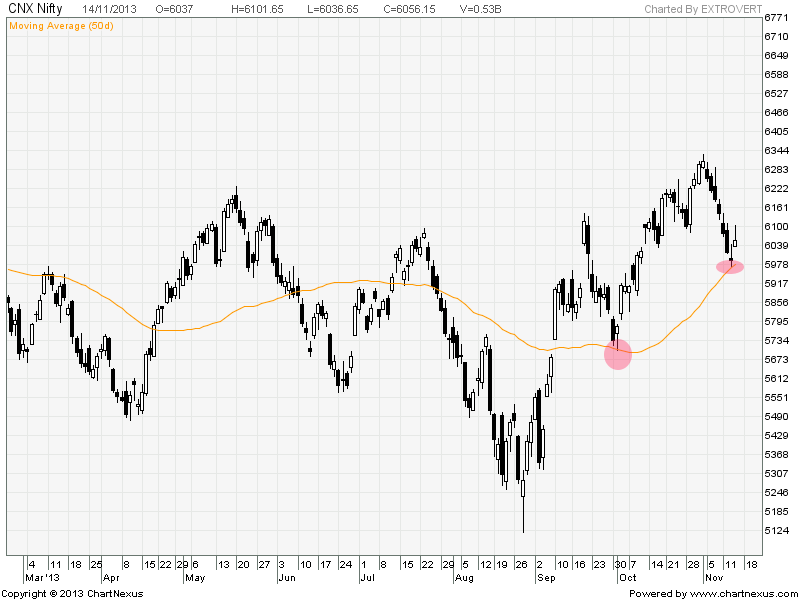
Nifty Daily chart took support at 50 DMA and bounced back last time also Nifty bounced from 50 SMA and moved till life highs, so will this time see another life highs.
Nifty Gaps
For Nifty traders who follow gap trading there are 5 trade gaps in the range of 5300-6000 and all other gaps got filled.
- 5285-5303
- 5448-5553
- 5680-5700
- 5780-5802
- 6185-6187
- 5989-6035
Fibonacci technique
Fibonacci fan
 Nifty Fibonacci fan are wonderful tool to find the top and bottom in short term.Nifty at resistance of Fibo Fan and support comes at 6000 as said last week and Nifty made low of 5989 before boucing back, So Fibo fan were again able to capture short term bottom.
Fibonacci Retracement
 80% retracement 5700-6342 comes at 6200 which would be be the zone of fight between bulls and bears.
Nifty Weekly Chart

Trading Monthly charts

Nifty monthly chart corrected from its Supply zone of 6337-6342 and gave corrective down move and completed the down move and is heading towards 6200 in short term.
Nifty Trading Levels
Nifty Trend Deciding Level:6108
Nifty Resistance:6170,6226 and 6300
Nifty Support:6077 ,5989 and 5950
Levels mentioned are Nifty Spot
Stock Performance Intraday sheet for Sep Month is updated on http://tradingsystemperformance.blogspot.com/
Stock Performance Positional sheet for Sep Month is updated on http://positionalcallsperformance.blogspot.com/
Let me go by Disclaimer these are my personal views and trade taken on these observation should be traded with strict Sl
Want to see post in your Inbox,Register by adding your email id in Post in your Inbox section
Follow on Facebook during Market Hours: https://www.facebook.com/pages/Brameshs-Tech/140117182685863