


Crude is trading at 3 year high on MCX, With Egypt conflict crude is rising and its a double whammy for INR, as rise in crude prices will increase fiscal deficit.Lets analyze crude technical for coming week.
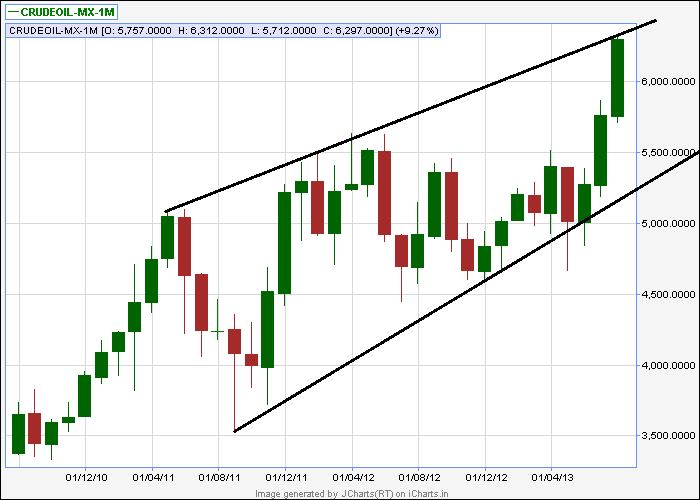
Crude Mcx Weekly

As per Weekly charts crude has formed a bullish engulfing pattern but unable to cross the higher end of upper channel@6312
Brent Crude Weekly Charts
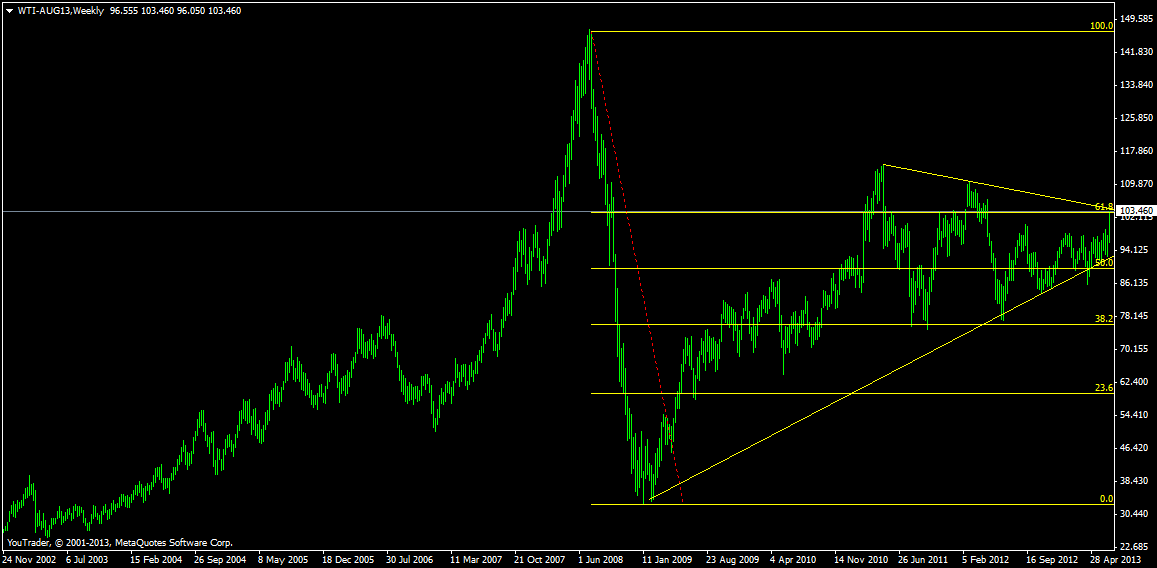
WTI crude on International chart is also facing trendline resistance at 103.4 which is also 61.8% retracement as seen in above chart, So confluence of falling trendline resistance and golden ratio should lead to pullback in crude.
Crude Mcx Monthly
Crude Trend Deciding Level:6424
Crude Resistance:6512,6569 and 6622
Crude Support :6336,6248 and 6155
Levels mentioned are Aug Expiry