Last week we gave Trend Deciding level as 6032 Nifty achieved 2 weekly targets on downside.
Key Events next week : Wednesday: April industrial output, May CPI inflation and Friday: May WPI inflation
Nifty Hourly Chart
Nifty Hourly charts are trading in triangle formation with range contraction going on .Break of 200 HSMA, has given more power to bears and below 5854 more blood on street.
Nifty Gaps
For Nifty traders who follow gap trading there are 1 trade gaps in the range of 5400-6000 and all other gaps got filled.
- 5836-5853
- 5477-5446
Nifty Daily Chart
On Daily chart Nifty is trading 20 DMA and 50 DMA , a bearish sign. The next stop for the index could be the long-term moving average (200-DMA)—5,790.
Fibonacci technique
As per of Fibo Retracement theory Nifty took support at 5854 which is 50 % retracement from 5477-6231. Below 5854 next strong support comes at 5790
Fibonacci fan
Nifty Fibonacci fan are wonderful tool to find the top and bottom in short term.Nifty closed below the Fibo Fans and we need to see follow up move in next week.
Nifty Weekly Chart
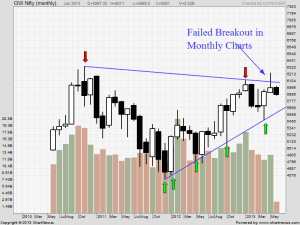
Trading Monthly charts
Monthly charts have given a failed breakout, Nifty has also formed a topping tails formation on the monthly charts. Topping tails are essentially bearish signals. Confirmation will come once Nifty closes and trades below 5937 on closing basis. — This is what we discussed last week and nifty rewarded us.
Nifty Trading Levels
Nifty Trend Deciding Level:5922
Nifty Resistance:5971,6011 and 6061
Nifty Support:5830,5790 and 5740
Levels mentioned are Nifty Spot
Let me go by Disclaimer these are my personal views and trade taken on these observation should be traded with strict Sl
Want to see post in your Inbox,Register by adding your email id in Post in your Inbox section
Follow on Facebook during Market Hours: https://www.facebook.com/pages/Brameshs-Tech/140117182685863


Sir good evening I am following your write up since one month it is very accurate
Sir please keep posting. Thank you
Dear Sridhar,
Thanks a lot!!
Rgds,
Bramesh